Here's What William Hill plc's (LON:WMH) ROCE Can Tell Us

Today we'll look at William Hill plc (LON:WMH) and reflect on its potential as an investment. To be precise, we'll consider its Return On Capital Employed (ROCE), as that will inform our view of the quality of the business.
First up, we'll look at what ROCE is and how we calculate it. Second, we'll look at its ROCE compared to similar companies. And finally, we'll look at how its current liabilities are impacting its ROCE.
What is Return On Capital Employed (ROCE)?
ROCE is a measure of a company's yearly pre-tax profit (its return), relative to the capital employed in the business. Generally speaking a higher ROCE is better. Overall, it is a valuable metric that has its flaws. Renowned investment researcher Michael Mauboussin has suggested that a high ROCE can indicate that 'one dollar invested in the company generates value of more than one dollar'.
So, How Do We Calculate ROCE?
The formula for calculating the return on capital employed is:
Return on Capital Employed = Earnings Before Interest and Tax (EBIT) ÷ (Total Assets - Current Liabilities)
Or for William Hill:
0.14 = UK£176m ÷ (UK£2.0b - UK£757m) (Based on the trailing twelve months to July 2019.)
Therefore, William Hill has an ROCE of 14%.
Check out our latest analysis for William Hill
Does William Hill Have A Good ROCE?
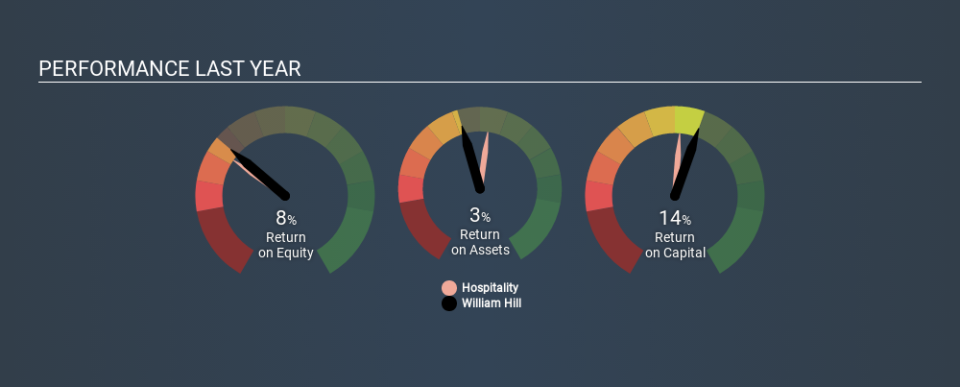
When making comparisons between similar businesses, investors may find ROCE useful. In our analysis, William Hill's ROCE is meaningfully higher than the 7.6% average in the Hospitality industry. I think that's good to see, since it implies the company is better than other companies at making the most of its capital. Independently of how William Hill compares to its industry, its ROCE in absolute terms appears decent, and the company may be worthy of closer investigation.
The image below shows how William Hill's ROCE compares to its industry, and you can click it to see more detail on its past growth.
Remember that this metric is backwards looking - it shows what has happened in the past, and does not accurately predict the future. ROCE can be deceptive for cyclical businesses, as returns can look incredible in boom times, and terribly low in downturns. ROCE is, after all, simply a snap shot of a single year. Since the future is so important for investors, you should check out our free report on analyst forecasts for William Hill.
How William Hill's Current Liabilities Impact Its ROCE
Short term (or current) liabilities, are things like supplier invoices, overdrafts, or tax bills that need to be paid within 12 months. The ROCE equation subtracts current liabilities from capital employed, so a company with a lot of current liabilities appears to have less capital employed, and a higher ROCE than otherwise. To check the impact of this, we calculate if a company has high current liabilities relative to its total assets.
William Hill has total assets of UK£2.0b and current liabilities of UK£757m. Therefore its current liabilities are equivalent to approximately 38% of its total assets. William Hill has a middling amount of current liabilities, increasing its ROCE somewhat.
The Bottom Line On William Hill's ROCE
With a decent ROCE, the company could be interesting, but remember that the level of current liabilities make the ROCE look better. William Hill shapes up well under this analysis, but it is far from the only business delivering excellent numbers . You might also want to check this free collection of companies delivering excellent earnings growth.
I will like William Hill better if I see some big insider buys. While we wait, check out this free list of growing companies with considerable, recent, insider buying.
If you spot an error that warrants correction, please contact the editor at editorial-team@simplywallst.com. This article by Simply Wall St is general in nature. It does not constitute a recommendation to buy or sell any stock, and does not take account of your objectives, or your financial situation. Simply Wall St has no position in the stocks mentioned.
We aim to bring you long-term focused research analysis driven by fundamental data. Note that our analysis may not factor in the latest price-sensitive company announcements or qualitative material. Thank you for reading.
