The Hidden Index Bubble
Investors around the world are flocking to passively managed funds. They do not trust that active funds -- that is, stock-pickers -- can get them better returns, especially after fees are accounted for.
The arguments for passive investing have been well-documented, and these investors are smart to listen to them. After all, even Warren Buffett promotes passive investing in low-cost index funds (perhaps the ultimate example of "do as I say, not as I do" in the investing world).
From 2009 to today, passive investing's share of assets under management in U.S. funds has increased from about 20% to 40%. In dollar terms, the amounts are staggering. Vanguard, the standard-bearer of passive investing, collected an astonishing $1 billion for each day of 2017, with 90% of net inflows directed to passive funds.
Avoiding fees, tracking the market, and even the "set it and forget it" investing style have their merits, especially for individual investors. But when hordes of investors pursue the same endgame, what does it mean for the market?
Research has shown that the repercussions of such a profound shift could be dramatic -- and even detrimental to long-term returns. Here's why.
Image source: Getty Images.
What "blind money" means
When active managers select stocks for a fund, they are essentially foraging for companies that will make good investments. If the stock market were a pumpkin patch, they'd be using the best pumpkin-picking strategy they know. This would be different from the strategies of other pumpkin-pickers, whose strategies in turn would be different from the next ones'. In other words, every fund manager has a unique approach to searching for the best investments available.
Passive investing is different. There is no manager. The money invested in a passive index fund is allocated to match the allocation of whichever index it tracks. That means passive investing is done "blindly": Index funds simply imitate their indexes' every move, with no input from professional stock-pickers.
The most well-known indexes are weighted based on the size -- i.e., the market capitalization -- of the companies within. That includes the most commonly tracked index, the S&P 500, which is essentially a collection of the 500 largest publicly traded U.S. companies as measured by market cap (some exceptions apply). The largest companies, then, receive the most investment when money flows into passive investments.
That money acts like water on the pumpkin patch. Every time money flows from active to passive management, it's as though water is flowing to the biggest pumpkins (i.e., holdings) by virtue of their size. And then, as a consequence of the new money, the big get bigger.
If this sounds peculiar, or even illogical, that's because it is. But it's how passive indexing works, and it's happening because investors have grown weary of the alternative: Active management often comes with oversized fees and underperformance.
The distorting power of passive investing
Passive indexing, then, is in vogue in recent years. Its increasing popularity adds incrementally to the market caps of all companies in the index -- but even more so to the largest ones. And this compounds over time. Ultimately, it can create distortions that will have consequences for investors.
Some of the most relevant research on this topic was published earlier this year by the investment advisor Semper Augustus. While most investors were rejoicing in the performance of indexes during 2017, Semper Augustus looked under the hood to see what was really happening. What the firm found is remarkable.
First off, the big are definitely getting bigger. In the case of the S&P 500, here's a look at what percentage of the index is made up by the largest five, 10, and 25 companies, respectively:
Group | Beginning 2017 | Ending 2017 |
|---|---|---|
Largest five | 11% | 13.3% |
Largest 10 | 18.9% | 21% |
Largest 25 | 29.2% | 31.1% |
Chart Source: Semper Augustus Investments Group's 2017 annual letter.
As shown, the top five largest companies grew more on a percentage basis than the top 10, which grew more than the top 25.
Second, if you only own the S&P 500, you might think you're more diversified than you are: Nearly a third of your returns are driven by only 25 companies.
As you move down the ranks of companies in the index, the growth variance gets smaller. The smallest 20% of the companies, in fact, didn't grow at all. Instead, this quintile of the S&P 500 actually shrank as a proportion of the index, from 4% to 3.6%.
At this point, its peculiar given the fact that the overall S&P value grew 21.8% during the year. Typically, one would expect that growth to be spread rather evenly across the constituents. This wasn't the case -- by a wide margin -- in 2017.
If you step back and look at the full spectrum of companies, the trend is undeniable: Measured by returns, the big are gaining, and the successively smaller are receiving less and less of the money inflow. The smallest are even shrinking.
Here's a look at S&P 500 returns by size of the companies:

Data source: Semper Augustus 2017 letter to investors. Chart by author.
When we look at another index, the Russell 2000, the trend is even more evident. The Russell 2000 is made up of the smallest 2,000 companies in the Russell 3000 (considered a "total market index"), and thus it has no overlap in companies with the S&P 500.
Different slice of the market, similar story:
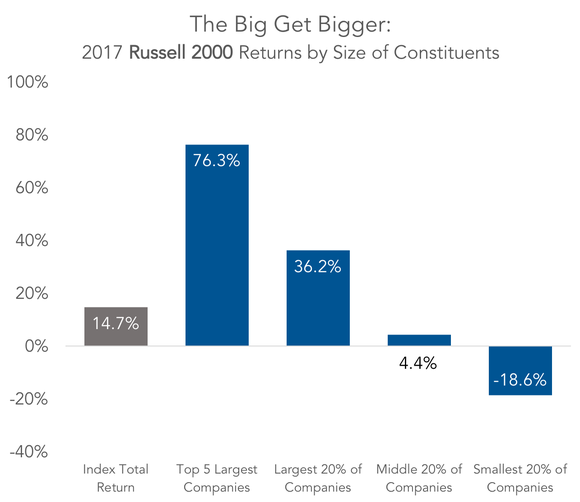
Data source: Semper Augustus 2017 letter to investors. Chart by author.
One could argue that smaller companies legitimately struggled in 2017 -- that it wasn't all about fund flows. Small companies, after all, tend to be thwarted by obstacles more often than their formidable blue-chip counterparts. While this could be true, it is unlikely to account for the massive gap in performance. Not to mention that a strong overall economy tends to provide the fertile conditions in which these small caps can experience rapid expansion, which leads to growth that large caps can't usually achieve due to their size.
How disparity can punish investors
It is nearly impossible to say to what degree this is distorting the market, but four things are clear:
Indexing is a form of "blind money" investing, where money flows to a subset of companies based not on their fundamentals but on their inclusion in the index.
The flow of money toward indexing is increasing.
As indexing receives more fund flows, the larges companies within the index receive proportionally more of those funds than the smaller ones.
The returns in 2017 show evidence that this is creating more "top-heavy" indexes overall.
What does this mean?
As money flows into passive index funds, it trickles down to the largest companies first -- companies like Apple, Microsoft, Amazon, and Facebook. What remains goes to their smaller counterparts, and so on.
There's no discriminating by the quality of the underlying business, the intrinsic value of the stock, or whether a management team's ability to compete within an industry is superior. So long as the shift from active to passive continues, this allocation to the biggest players will hold.
For investors, this raises questions about whether there's a bubble within index investing. So far, valuation metrics like price-to-earnings ratios have not gone completely haywire, as they did in 1999 during the dot-com bubble. Back then, the cyclically adjusted price-to-earnings (CAPE) ratio was nearing 45 at the time of that bubble's collapse; it's at 33 today.
But that time frame provides some context. In 1998, just before the dot-com bubble, the largest stocks were thriving. The 10 largest companies in the U.S. market were up 38.5% that year. Then the market turned and took everyone with it -- shareholders in small and large companies alike.
This downturn stung all investors, but it stung those who were overly invested in large companies the most. For example, the S&P 500 turned in annualized returns of only 4.5% during the 17 1/2 years that followed. That's a dismal streak compared to the index's historical average return of 10%. Even compared to the index's inflation-adjusted return of 7%, it looks lackluster.
And those top 10 stocks? Eight underperformed the S&P 500. The two that beat it -- Walmart and ExxonMobil -- returned 5% and 6% annualized during that uninspiring stretch of time.
Ignore fundamentals at your own risk
The problem is not indexing itself, but rather the market's recent open-arms embrace of it. Again, its share of assets under management has doubled since 2009.
The consequence is an ocean of money flowing into the largest companies for reasons that could be unrelated to their merits as investments. As a result, their market value can-over time-become grossly detached from their underlying prospects and fundamentals.
Warren Buffett, on the other hand, has always been loyal to fundamentals. For comparison, Buffett's Berkshire Hathaway trounced the market over the same stretch mentioned above: From July 1999 to year-end 2017, Berkshire achieved an 8.3% annualized return. Imagine the difference a return of 8.3% versus 4.5% could make in a retirement account over 17 1/2 years.
For now, the movement toward passive investing shows no signs of slowing -- thanks, in part, to Buffett. Indexes could get even more top-heavy in the years ahead, and at some point the largest stocks, inflated with passive money, could falter due to overblown expectations. That's the danger.
On the flip side, savvy investors can see the opportunity this presents, especially in smaller companies with strong fundamentals. If everyone else is unconsciously distorting the market toward one end, there's likely to be tremendous value at the other.
More From The Motley Fool
John Mackey, CEO of Whole Foods Market, an Amazon subsidiary, is a member of The Motley Fool's board of directors. Teresa Kersten is an employee of LinkedIn and is a member of The Motley Fool's board of directors; LinkedIn is owned by Microsoft. Isaac Pino, CPA owns shares of MSFT. His clients may have positions in the stocks discussed. The Motley Fool owns shares of and recommends AMZN, AAPL, BRK-B, and FB. The Motley Fool has the following options: long January 2020 $150 calls on AAPL and short January 2020 $155 calls on AAPL. The Motley Fool has a disclosure policy.
