Is Hillenbrand Inc’s (NYSE:HI) Balance Sheet Strong Enough To Weather A Storm?

Small-caps and large-caps are wildly popular among investors, however, mid-cap stocks, such as Hillenbrand Inc (NYSE:HI), with a market capitalization of $2.85B, rarely draw their attention from the investing community. However, generally ignored mid-caps have historically delivered better risk-adjusted returns than the two other categories of stocks. This article will examine HI’s financial liquidity and debt levels to get an idea of whether the company can deal with cyclical downturns and maintain funds to accommodate strategic spending for future growth. Note that this commentary is very high-level and solely focused on financial health, so I suggest you dig deeper yourself into HI here. View our latest analysis for Hillenbrand
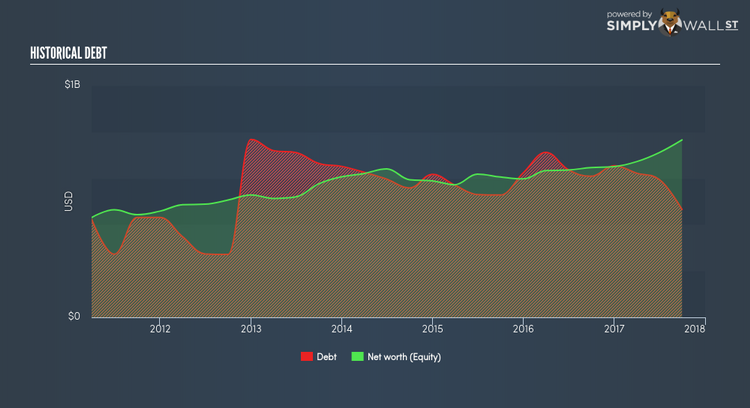
How does HI’s operating cash flow stack up against its debt?
Over the past year, HI has reduced its debt from $608.9M to $465.7M , which comprises of short- and long-term debt. With this debt payback, HI’s cash and short-term investments stands at $66.0M for investing into the business. On top of this, HI has generated cash from operations of $246.2M in the last twelve months, resulting in an operating cash to total debt ratio of 52.87%, signalling that HI’s current level of operating cash is high enough to cover debt. This ratio can also be interpreted as a measure of efficiency as an alternative to return on assets. In HI’s case, it is able to generate 0.53x cash from its debt capital.
Can HI pay its short-term liabilities?
At the current liabilities level of $511.7M liabilities, it seems that the business has maintained a safe level of current assets to meet its obligations, with the current ratio last standing at 1.16x. Generally, for Machinery companies, this is a reasonable ratio since there’s sufficient cash cushion without leaving too much capital idle or in low-earning investments.
Can HI service its debt comfortably?
With debt reaching 60.80% of equity, HI may be thought of as relatively highly levered. This is not unusual for mid-caps as debt tends to be a cheaper and faster source of funding for some businesses. We can check to see whether HI is able to meet its debt obligations by looking at the net interest coverage ratio. A company generating earnings before interest and tax (EBIT) at least three times its net interest payments is considered financially sound. In HI’s, case, the ratio of 9.17x suggests that interest is appropriately covered, which means that debtors may be willing to loan the company more money, giving HI ample headroom to grow its debt facilities.
Next Steps:
HI’s high cash coverage means that, although its debt levels are high, the company is able to utilise its borrowings efficiently in order to generate cash flow. This may mean this is an optimal capital structure for the business, given that it is also meeting its short-term commitment. This is only a rough assessment of financial health, and I’m sure HI has company-specific issues impacting its capital structure decisions. I suggest you continue to research Hillenbrand to get a more holistic view of the mid-cap by looking at:
1. Future Outlook: What are well-informed industry analysts predicting for HI’s future growth? Take a look at our free research report of analyst consensus for HI’s outlook.
2. Valuation: What is HI worth today? Is the stock undervalued, even when its growth outlook is factored into its intrinsic value? The intrinsic value infographic in our free research report helps visualize whether HI is currently mispriced by the market.
3. Other High-Performing Stocks: Are there other stocks that provide better prospects with proven track records? Explore our free list of these great stocks here.
To help readers see pass the short term volatility of the financial market, we aim to bring you a long-term focused research analysis purely driven by fundamental data. Note that our analysis does not factor in the latest price sensitive company announcements.
The author is an independent contributor and at the time of publication had no position in the stocks mentioned.
