What Is Hillenbrand's (NYSE:HI) P/E Ratio After Its Share Price Tanked?

To the annoyance of some shareholders, Hillenbrand (NYSE:HI) shares are down a considerable 32% in the last month. Indeed the recent decline has arguably caused some bitterness for shareholders who have held through the 54% drop over twelve months.
Assuming nothing else has changed, a lower share price makes a stock more attractive to potential buyers. While the market sentiment towards a stock is very changeable, in the long run, the share price will tend to move in the same direction as earnings per share. So, on certain occasions, long term focussed investors try to take advantage of pessimistic expectations to buy shares at a better price. Perhaps the simplest way to get a read on investors' expectations of a business is to look at its Price to Earnings Ratio (PE Ratio). Investors have optimistic expectations of companies with higher P/E ratios, compared to companies with lower P/E ratios.
View our latest analysis for Hillenbrand
How Does Hillenbrand's P/E Ratio Compare To Its Peers?
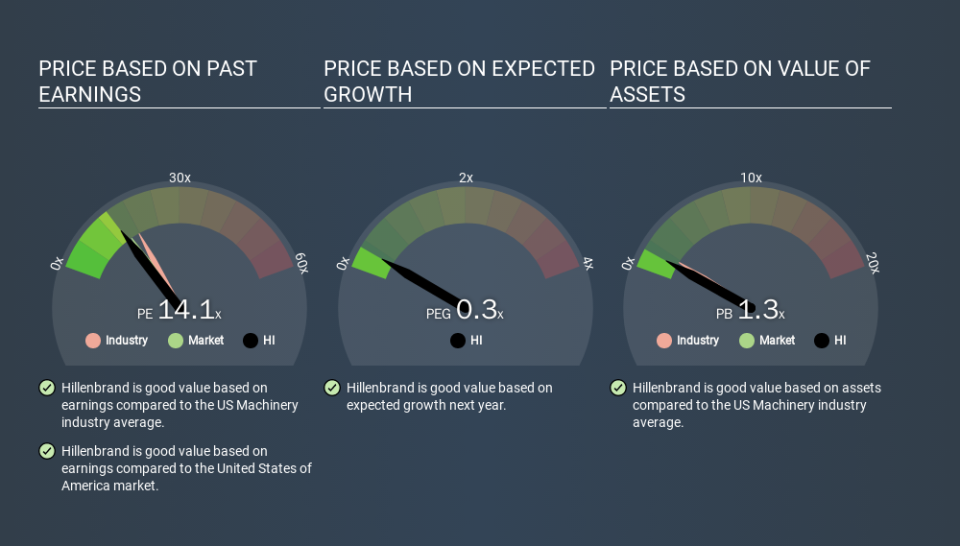
Hillenbrand's P/E of 14.10 indicates relatively low sentiment towards the stock. If you look at the image below, you can see Hillenbrand has a lower P/E than the average (17.2) in the machinery industry classification.
Hillenbrand's P/E tells us that market participants think it will not fare as well as its peers in the same industry. Many investors like to buy stocks when the market is pessimistic about their prospects. If you consider the stock interesting, further research is recommended. For example, I often monitor director buying and selling.
How Growth Rates Impact P/E Ratios
When earnings fall, the 'E' decreases, over time. That means unless the share price falls, the P/E will increase in a few years. Then, a higher P/E might scare off shareholders, pushing the share price down.
Hillenbrand had pretty flat EPS growth in the last year. And over the longer term (5 years) earnings per share have decreased 5.7% annually. So it would be surprising to see a high P/E.
Remember: P/E Ratios Don't Consider The Balance Sheet
The 'Price' in P/E reflects the market capitalization of the company. That means it doesn't take debt or cash into account. In theory, a company can lower its future P/E ratio by using cash or debt to invest in growth.
Such spending might be good or bad, overall, but the key point here is that you need to look at debt to understand the P/E ratio in context.
Is Debt Impacting Hillenbrand's P/E?
Hillenbrand's net debt is considerable, at 117% of its market cap. This is a relatively high level of debt, so the stock probably deserves a relatively low P/E ratio. Keep that in mind when comparing it to other companies.
The Verdict On Hillenbrand's P/E Ratio
Hillenbrand trades on a P/E ratio of 14.1, which is fairly close to the US market average of 14.7. With meaningful debt and only modest earnings growth, the market seems to be expecting a steady performance going forward. Given Hillenbrand's P/E ratio has declined from 20.7 to 14.1 in the last month, we know for sure that the market is significantly less confident about the business today, than it was back then. For those who don't like to trade against momentum, that could be a warning sign, but a contrarian investor might want to take a closer look.
Investors have an opportunity when market expectations about a stock are wrong. As value investor Benjamin Graham famously said, 'In the short run, the market is a voting machine but in the long run, it is a weighing machine. So this free report on the analyst consensus forecasts could help you make a master move on this stock.
You might be able to find a better buy than Hillenbrand. If you want a selection of possible winners, check out this free list of interesting companies that trade on a P/E below 20 (but have proven they can grow earnings).
If you spot an error that warrants correction, please contact the editor at editorial-team@simplywallst.com. This article by Simply Wall St is general in nature. It does not constitute a recommendation to buy or sell any stock, and does not take account of your objectives, or your financial situation. Simply Wall St has no position in the stocks mentioned.
We aim to bring you long-term focused research analysis driven by fundamental data. Note that our analysis may not factor in the latest price-sensitive company announcements or qualitative material. Thank you for reading.
