Hillenbrand's (NYSE:HI) three-year total shareholder returns outpace the underlying earnings growth
The most you can lose on any stock (assuming you don't use leverage) is 100% of your money. But when you pick a company that is really flourishing, you can make more than 100%. To wit, the Hillenbrand, Inc. (NYSE:HI) share price has flown 114% in the last three years. That sort of return is as solid as granite. Unfortunately, though, the stock has dropped 7.5% over a week. But this could be related to the soft market, with stocks selling off around 0.7% in the last week.
Although Hillenbrand has shed US$248m from its market cap this week, let's take a look at its longer term fundamental trends and see if they've driven returns.
View our latest analysis for Hillenbrand
There is no denying that markets are sometimes efficient, but prices do not always reflect underlying business performance. By comparing earnings per share (EPS) and share price changes over time, we can get a feel for how investor attitudes to a company have morphed over time.
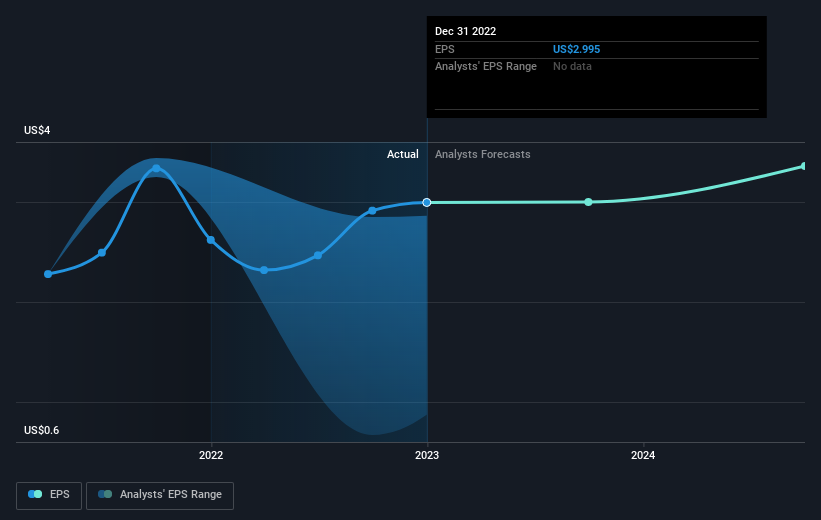
During three years of share price growth, Hillenbrand achieved compound earnings per share growth of 30% per year. This EPS growth is remarkably close to the 29% average annual increase in the share price. That suggests that the market sentiment around the company hasn't changed much over that time. Quite to the contrary, the share price has arguably reflected the EPS growth.
You can see how EPS has changed over time in the image below (click on the chart to see the exact values).
We consider it positive that insiders have made significant purchases in the last year. Having said that, most people consider earnings and revenue growth trends to be a more meaningful guide to the business. Dive deeper into the earnings by checking this interactive graph of Hillenbrand's earnings, revenue and cash flow.
What About Dividends?
As well as measuring the share price return, investors should also consider the total shareholder return (TSR). The TSR incorporates the value of any spin-offs or discounted capital raisings, along with any dividends, based on the assumption that the dividends are reinvested. So for companies that pay a generous dividend, the TSR is often a lot higher than the share price return. We note that for Hillenbrand the TSR over the last 3 years was 128%, which is better than the share price return mentioned above. This is largely a result of its dividend payments!
A Different Perspective
We're pleased to report that Hillenbrand shareholders have received a total shareholder return of 7.6% over one year. And that does include the dividend. That gain is better than the annual TSR over five years, which is 1.0%. Therefore it seems like sentiment around the company has been positive lately. Someone with an optimistic perspective could view the recent improvement in TSR as indicating that the business itself is getting better with time. I find it very interesting to look at share price over the long term as a proxy for business performance. But to truly gain insight, we need to consider other information, too. For instance, we've identified 1 warning sign for Hillenbrand that you should be aware of.
There are plenty of other companies that have insiders buying up shares. You probably do not want to miss this free list of growing companies that insiders are buying.
Please note, the market returns quoted in this article reflect the market weighted average returns of stocks that currently trade on American exchanges.
Have feedback on this article? Concerned about the content? Get in touch with us directly. Alternatively, email editorial-team (at) simplywallst.com.
This article by Simply Wall St is general in nature. We provide commentary based on historical data and analyst forecasts only using an unbiased methodology and our articles are not intended to be financial advice. It does not constitute a recommendation to buy or sell any stock, and does not take account of your objectives, or your financial situation. We aim to bring you long-term focused analysis driven by fundamental data. Note that our analysis may not factor in the latest price-sensitive company announcements or qualitative material. Simply Wall St has no position in any stocks mentioned.
Join A Paid User Research Session
You’ll receive a US$30 Amazon Gift card for 1 hour of your time while helping us build better investing tools for the individual investors like yourself. Sign up here
