How Hilton Food Group plc (LON:HFG) Delivered A Better ROE Than Its Industry

I am writing today to help inform people who are new to the stock market and want to learn about Return on Equity using a real-life example.
With an ROE of 17.6%, Hilton Food Group plc (LON:HFG) outpaced its own industry which delivered a less exciting 9.8% over the past year. On the surface, this looks fantastic since we know that HFG has made large profits from little equity capital; however, ROE doesn’t tell us if management have borrowed heavily to make this happen. In this article, we’ll closely examine some factors like financial leverage to evaluate the sustainability of HFG’s ROE.
Check out our latest analysis for Hilton Food Group
Breaking down Return on Equity
Firstly, Return on Equity, or ROE, is simply the percentage of last years’ earning against the book value of shareholders’ equity. An ROE of 17.6% implies £0.18 returned on every £1 invested. In most cases, a higher ROE is preferred; however, there are many other factors we must consider prior to making any investment decisions.
Return on Equity = Net Profit ÷ Shareholders Equity
ROE is assessed against cost of equity, which is measured using the Capital Asset Pricing Model (CAPM) – but let’s not dive into the details of that today. For now, let’s just look at the cost of equity number for Hilton Food Group, which is 8.3%. Given a positive discrepancy of 9.4% between return and cost, this indicates that Hilton Food Group pays less for its capital than what it generates in return, which is a sign of capital efficiency. ROE can be dissected into three distinct ratios: net profit margin, asset turnover, and financial leverage. This is called the Dupont Formula:
Dupont Formula
ROE = profit margin × asset turnover × financial leverage
ROE = (annual net profit ÷ sales) × (sales ÷ assets) × (assets ÷ shareholders’ equity)
ROE = annual net profit ÷ shareholders’ equity

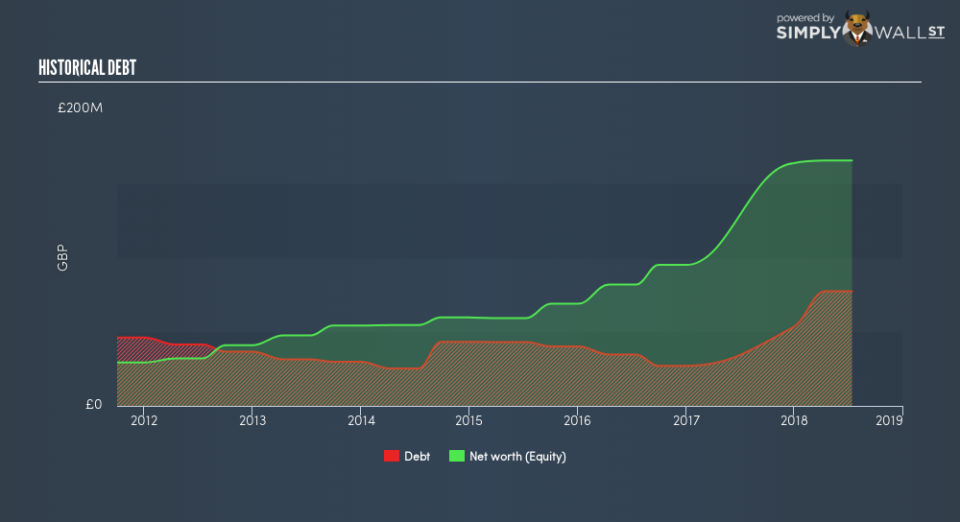
Basically, profit margin measures how much of revenue trickles down into earnings which illustrates how efficient the business is with its cost management. Asset turnover reveals how much revenue can be generated from Hilton Food Group’s asset base. And finally, financial leverage is simply how much of assets are funded by equity, which exhibits how sustainable the company’s capital structure is. Since ROE can be inflated by excessive debt, we need to examine Hilton Food Group’s debt-to-equity level. The debt-to-equity ratio currently stands at a low 46.8%, meaning the above-average ROE is due to its capacity to produce profit growth without a huge debt burden.
Next Steps:
ROE is a simple yet informative ratio, illustrating the various components that each measure the quality of the overall stock. Hilton Food Group’s ROE is impressive relative to the industry average and also covers its cost of equity. ROE is not likely to be inflated by excessive debt funding, giving shareholders more conviction in the sustainability of high returns. Although ROE can be a useful metric, it is only a small part of diligent research.
For Hilton Food Group, I’ve put together three key aspects you should further research:
Financial Health: Does it have a healthy balance sheet? Take a look at our free balance sheet analysis with six simple checks on key factors like leverage and risk.
Valuation: What is Hilton Food Group worth today? Is the stock undervalued, even when its growth outlook is factored into its intrinsic value? The intrinsic value infographic in our free research report helps visualize whether Hilton Food Group is currently mispriced by the market.
Other High-Growth Alternatives : Are there other high-growth stocks you could be holding instead of Hilton Food Group? Explore our interactive list of stocks with large growth potential to get an idea of what else is out there you may be missing!
To help readers see past the short term volatility of the financial market, we aim to bring you a long-term focused research analysis purely driven by fundamental data. Note that our analysis does not factor in the latest price-sensitive company announcements.
The author is an independent contributor and at the time of publication had no position in the stocks mentioned. For errors that warrant correction please contact the editor at editorial-team@simplywallst.com.
