HMS Holdings Corp.’s (NASDAQ:HMSY) Investment Returns Are Lagging Its Industry

Today we are going to look at HMS Holdings Corp. (NASDAQ:HMSY) to see whether it might be an attractive investment prospect. Specifically, we’ll consider its Return On Capital Employed (ROCE), since that will give us an insight into how efficiently the business can generate profits from the capital it requires.
First, we’ll go over how we calculate ROCE. Then we’ll compare its ROCE to similar companies. And finally, we’ll look at how its current liabilities are impacting its ROCE.
Understanding Return On Capital Employed (ROCE)
ROCE is a metric for evaluating how much pre-tax income (in percentage terms) a company earns on the capital invested in its business. Generally speaking a higher ROCE is better. In brief, it is a useful tool, but it is not without drawbacks. Renowned investment researcher Michael Mauboussin has suggested that a high ROCE can indicate that ‘one dollar invested in the company generates value of more than one dollar’.
How Do You Calculate Return On Capital Employed?
Analysts use this formula to calculate return on capital employed:
Return on Capital Employed = Earnings Before Interest and Tax (EBIT) ÷ (Total Assets – Current Liabilities)
Or for HMS Holdings:
0.081 = US$55m ÷ (US$1.0b – US$86m) (Based on the trailing twelve months to September 2018.)
Therefore, HMS Holdings has an ROCE of 8.1%.
See our latest analysis for HMS Holdings
Want to help shape the future of investing tools and platforms? Take the survey and be part of one of the most advanced studies of stock market investors to date.
Does HMS Holdings Have A Good ROCE?
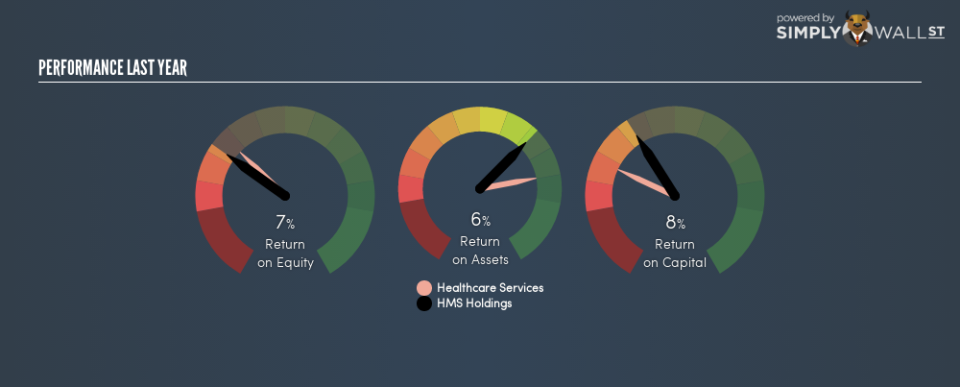
One way to assess ROCE is to compare similar companies. It appears that HMS Holdings’s ROCE is fairly close to the Healthcare Services industry average of 8.1%. Aside from the industry comparison, HMS Holdings’s ROCE is mediocre in absolute terms, considering the risk of investing in stocks versus the safety of a bank account. It is possible that there are more rewarding investments out there.
Our data shows that HMS Holdings currently has an ROCE of 8.1%, compared to its ROCE of 4.2% 3 years ago. This makes us think the business might be improving.
Remember that this metric is backwards looking – it shows what has happened in the past, and does not accurately predict the future. ROCE can be misleading for companies in cyclical industries, with returns looking impressive during the boom times, but very weak during the busts. This is because ROCE only looks at one year, instead of considering returns across a whole cycle. What happens in the future is pretty important for investors, so we have prepared a free report on analyst forecasts for HMS Holdings.
How HMS Holdings’s Current Liabilities Impact Its ROCE
Liabilities, such as supplier bills and bank overdrafts, are referred to as current liabilities if they need to be paid within 12 months. Due to the way ROCE is calculated, a high level of current liabilities makes a company look as though it has less capital employed, and thus can (sometimes unfairly) boost the ROCE. To check the impact of this, we calculate if a company has high current liabilities relative to its total assets.
HMS Holdings has total liabilities of US$86m and total assets of US$1.0b. As a result, its current liabilities are equal to approximately 8.6% of its total assets. HMS Holdings has a low level of current liabilities, which have a minimal impact on its uninspiring ROCE.
What We Can Learn From HMS Holdings’s ROCE
HMS Holdings looks like an ok business, but on this analysis it is not at the top of our buy list. But note: HMS Holdings may not be the best stock to buy. So take a peek at this free list of interesting companies with strong recent earnings growth (and a P/E ratio below 20).
I will like HMS Holdings better if I see some big insider buys. While we wait, check out this free list of growing companies with considerable, recent, insider buying.
To help readers see past the short term volatility of the financial market, we aim to bring you a long-term focused research analysis purely driven by fundamental data. Note that our analysis does not factor in the latest price-sensitive company announcements.
The author is an independent contributor and at the time of publication had no position in the stocks mentioned. For errors that warrant correction please contact the editor at editorial-team@simplywallst.com.
