Should You Like HongGuang Lighting Holdings Company Limited’s (HKG:8343) High Return On Capital Employed?

Today we are going to look at HongGuang Lighting Holdings Company Limited (HKG:8343) to see whether it might be an attractive investment prospect. To be precise, we'll consider its Return On Capital Employed (ROCE), as that will inform our view of the quality of the business.
First up, we'll look at what ROCE is and how we calculate it. Then we'll compare its ROCE to similar companies. Last but not least, we'll look at what impact its current liabilities have on its ROCE.
Understanding Return On Capital Employed (ROCE)
ROCE is a metric for evaluating how much pre-tax income (in percentage terms) a company earns on the capital invested in its business. Generally speaking a higher ROCE is better. In brief, it is a useful tool, but it is not without drawbacks. Author Edwin Whiting says to be careful when comparing the ROCE of different businesses, since 'No two businesses are exactly alike.
How Do You Calculate Return On Capital Employed?
The formula for calculating the return on capital employed is:
Return on Capital Employed = Earnings Before Interest and Tax (EBIT) ÷ (Total Assets - Current Liabilities)
Or for HongGuang Lighting Holdings:
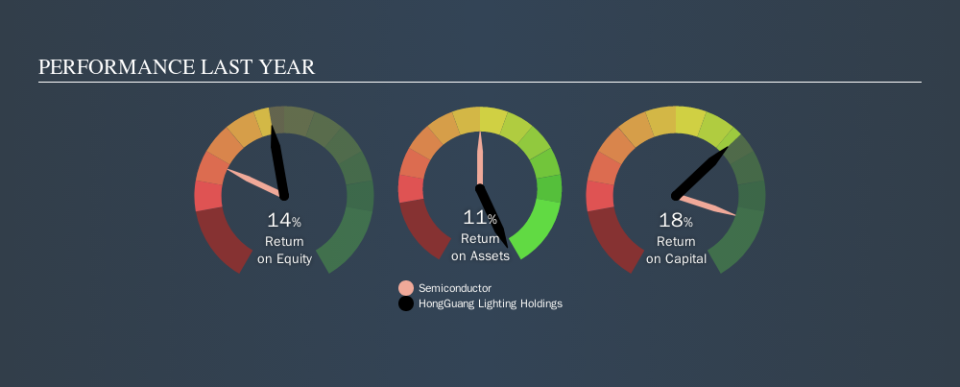
0.18 = CN¥27m ÷ (CN¥193m - CN¥38m) (Based on the trailing twelve months to June 2019.)
So, HongGuang Lighting Holdings has an ROCE of 18%.
Check out our latest analysis for HongGuang Lighting Holdings
Is HongGuang Lighting Holdings's ROCE Good?
ROCE can be useful when making comparisons, such as between similar companies. HongGuang Lighting Holdings's ROCE appears to be substantially greater than the 6.1% average in the Semiconductor industry. We would consider this a positive, as it suggests it is using capital more effectively than other similar companies. Regardless of where HongGuang Lighting Holdings sits next to its industry, its ROCE in absolute terms appears satisfactory, and this company could be worth a closer look.
HongGuang Lighting Holdings's current ROCE of 18% is lower than its ROCE in the past, which was 25%, 3 years ago. So investors might consider if it has had issues recently. You can see in the image below how HongGuang Lighting Holdings's ROCE compares to its industry. Click to see more on past growth.
It is important to remember that ROCE shows past performance, and is not necessarily predictive. Companies in cyclical industries can be difficult to understand using ROCE, as returns typically look high during boom times, and low during busts. ROCE is only a point-in-time measure. How cyclical is HongGuang Lighting Holdings? You can see for yourself by looking at this free graph of past earnings, revenue and cash flow.
HongGuang Lighting Holdings's Current Liabilities And Their Impact On Its ROCE
Current liabilities are short term bills and invoices that need to be paid in 12 months or less. The ROCE equation subtracts current liabilities from capital employed, so a company with a lot of current liabilities appears to have less capital employed, and a higher ROCE than otherwise. To check the impact of this, we calculate if a company has high current liabilities relative to its total assets.
HongGuang Lighting Holdings has total liabilities of CN¥38m and total assets of CN¥193m. As a result, its current liabilities are equal to approximately 20% of its total assets. Low current liabilities are not boosting the ROCE too much.
What We Can Learn From HongGuang Lighting Holdings's ROCE
With that in mind, HongGuang Lighting Holdings's ROCE appears pretty good. HongGuang Lighting Holdings looks strong on this analysis, but there are plenty of other companies that could be a good opportunity . Here is a free list of companies growing earnings rapidly.
For those who like to find winning investments this free list of growing companies with recent insider purchasing, could be just the ticket.
We aim to bring you long-term focused research analysis driven by fundamental data. Note that our analysis may not factor in the latest price-sensitive company announcements or qualitative material.
If you spot an error that warrants correction, please contact the editor at editorial-team@simplywallst.com. This article by Simply Wall St is general in nature. It does not constitute a recommendation to buy or sell any stock, and does not take account of your objectives, or your financial situation. Simply Wall St has no position in the stocks mentioned. Thank you for reading.
