Is New Hope Corporation Limited’s (ASX:NHC) 17% ROCE Any Good?

Want to participate in a research study? Help shape the future of investing tools and earn a $60 gift card!
Today we are going to look at New Hope Corporation Limited (ASX:NHC) to see whether it might be an attractive investment prospect. In particular, we'll consider its Return On Capital Employed (ROCE), as that can give us insight into how profitably the company is able to employ capital in its business.
Firstly, we'll go over how we calculate ROCE. Next, we'll compare it to others in its industry. Then we'll determine how its current liabilities are affecting its ROCE.
Return On Capital Employed (ROCE): What is it?
ROCE measures the 'return' (pre-tax profit) a company generates from capital employed in its business. In general, businesses with a higher ROCE are usually better quality. Ultimately, it is a useful but imperfect metric. Renowned investment researcher Michael Mauboussin has suggested that a high ROCE can indicate that 'one dollar invested in the company generates value of more than one dollar'.
How Do You Calculate Return On Capital Employed?
The formula for calculating the return on capital employed is:
Return on Capital Employed = Earnings Before Interest and Tax (EBIT) ÷ (Total Assets - Current Liabilities)
Or for New Hope:
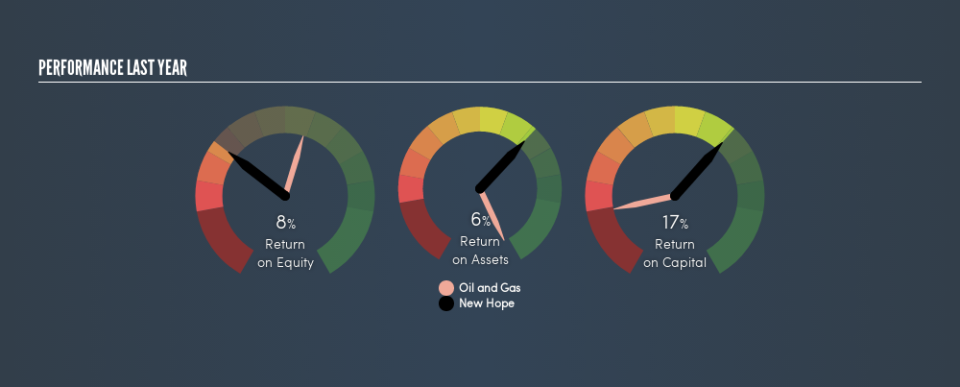
0.17 = AU$410m ÷ (AU$2.7b - AU$252m) (Based on the trailing twelve months to January 2019.)
So, New Hope has an ROCE of 17%.
View our latest analysis for New Hope
Is New Hope's ROCE Good?
ROCE is commonly used for comparing the performance of similar businesses. Using our data, we find that New Hope's ROCE is meaningfully better than the 10% average in the Oil and Gas industry. I think that's good to see, since it implies the company is better than other companies at making the most of its capital. Separate from New Hope's performance relative to its industry, its ROCE in absolute terms looks satisfactory, and it may be worth researching in more depth.
New Hope has an ROCE of 17%, but it didn't have an ROCE 3 years ago, since it was unprofitable. This makes us wonder if the company is improving.
It is important to remember that ROCE shows past performance, and is not necessarily predictive. Companies in cyclical industries can be difficult to understand using ROCE, as returns typically look high during boom times, and low during busts. This is because ROCE only looks at one year, instead of considering returns across a whole cycle. Given the industry it operates in, New Hope could be considered cyclical. What happens in the future is pretty important for investors, so we have prepared a free report on analyst forecasts for New Hope.
Do New Hope's Current Liabilities Skew Its ROCE?
Current liabilities are short term bills and invoices that need to be paid in 12 months or less. Due to the way the ROCE equation works, having large bills due in the near term can make it look as though a company has less capital employed, and thus a higher ROCE than usual. To check the impact of this, we calculate if a company has high current liabilities relative to its total assets.
New Hope has total assets of AU$2.7b and current liabilities of AU$252m. Therefore its current liabilities are equivalent to approximately 9.4% of its total assets. In addition to low current liabilities (making a negligible impact on ROCE), New Hope earns a sound return on capital employed.
What We Can Learn From New Hope's ROCE
This is good to see, and while better prospects may exist, New Hope seems worth researching further. Of course, you might find a fantastic investment by looking at a few good candidates. So take a peek at this free list of companies with modest (or no) debt, trading on a P/E below 20.
If you like to buy stocks alongside management, then you might just love this free list of companies. (Hint: insiders have been buying them).
We aim to bring you long-term focused research analysis driven by fundamental data. Note that our analysis may not factor in the latest price-sensitive company announcements or qualitative material.
If you spot an error that warrants correction, please contact the editor at editorial-team@simplywallst.com. This article by Simply Wall St is general in nature. It does not constitute a recommendation to buy or sell any stock, and does not take account of your objectives, or your financial situation. Simply Wall St has no position in the stocks mentioned. Thank you for reading.
