Hunt For Yield Can Blur ETF Returns

With both the 10-year U.S. Treasury yield and the dividend yield of the S&P 500 hovering around 1.3%, yield-hungry investors have had to get creative to generate income. But the hunt for yield has its pitfalls.
Hunting for yield often means venturing further out on the risk spectrum to achieve higher distributions. However, this additional risk can mean greater drawdowns if markets turn sour. Investors can easily put their portfolios at risk by prioritizing yield over total return.
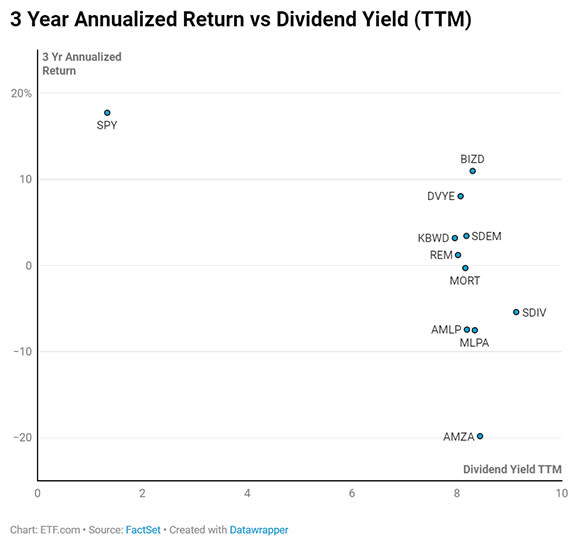
Consider the following chart, showing the 10 ETFs with the highest dividend yield as identified by ETF.com’s ETF Screener & Database. The chart plots these ETFs and their yields against their three-year annualized returns.
(For a larger view, click on the image above)
Yield Not Correlated With Return
Each of these ETFs has a dividend yield around 8-9%. However, this yield has no correlation to the trailing three-year return for these funds. Annualized returns range from a loss of nearly -20% to a gain of 11% and everywhere in between.
Compare this to the SPDR S&P 500 ETF Trust (SPY), which stands apart from the rest on the chart. SPY’s dividend yield is 1.3%, a fraction of that of these other ETFs. Yet the three-year annualized return is 17.7%, nearly 7% higher than that of BIZD.
Because these annualized returns are total returns, they are inclusive of the yield component.
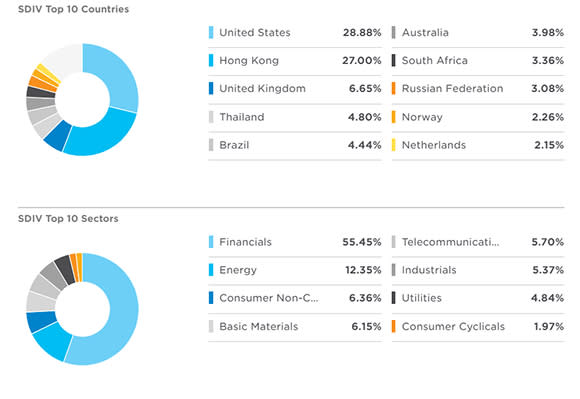
Currently, the ETF with the highest dividend yield is the Global X SuperDividend ETF (SDIV). This ETF tracks an equal-weighted index of 100 global securities, including emerging markets, with high yields. The fund holds 27% in Hong Kong-listed companies, potentially a risk should the Chinese government crack down on these holdings. (Read: China’s Heavy Hand In Emerging Market ETFs)
Chart courtesy of FactSet
(For a larger view, click on the image above)
The ETF also has over half of the portfolio in financials. Compare this to the iShares MSCI ACWI ETF (ACWI), a global ETF that tracks a cap-weighted index of developed as well as emerging market stocks.
Chart courtesy of FactSet
(For a larger view, click on the image above)
SDIV has more than triple the financials exposure of ACWI, which could cause the portfolio to underperform the broad global ETF should this sector struggle.
Though SDIV’s dividend yield is compelling, performance of the fund over the trailing three years has been less so. The fund is down more than 15% versus a 62% gain for SPY and a 49% gain for ACWI over the same time frame.

Drawdowns’ Impact On Income
If a yield-seeking investor had invested in SDIV three years ago, they would have less money than they started with. This is obviously not a desirable outcome, for several reasons.
Not only do investors want to avoid losing money, a decline in the value of the portfolio makes it more difficult for the investor to generate the income they need going forward. A 4% yield on $1 million is $40,000. But if that portfolio’s value declines to $850,000, that 4% yield falls to $34,000.
This increases the chances that the investor might try to stretch more for yield, taking on even more risk to meet their income needs.
This hypothetical investor would have been better served by investing in either SPY or ACWI despite the lower dividend yield, trimming the allocation over time to meet their income needs.
While SDIV might very well have a place in your portfolio, the investment selection process needs to go beyond yield. Investors also need to consider the ETF’s construction and where it fits into their total asset allocation.
Taxes A Factor Too
For those with assets in taxable accounts, there are different tax treatments for dividend income and capital gains that need to be considered.
Dividends can be qualified or unqualified. Qualified dividends receive preferential tax treatment, provided they meet specific requirements as set forth by the IRS. Dividends that don’t meet these requirements can be taxed up to 37%.
Capital gains also face differing treatment depending on how long a security is held. However, if a security is held for longer than one year, any capital gains are taxed at a maximum rate of 20%.
Differences in taxation can have significant impact on the future value of a portfolio, and along with downside risk, should be taken into full consideration when deciding how to meet the need for income.
Contact Jessica Ferringer at jessica.ferringer@etf.com or follow her on Twitter
Recommended Stories


