IAR Systems Group AB (publ) (STO:IAR B) Earns A Nice Return On Capital Employed

Want to participate in a research study? Help shape the future of investing tools and earn a $60 gift card!
Today we'll evaluate IAR Systems Group AB (publ) (STO:IAR B) to determine whether it could have potential as an investment idea. To be precise, we'll consider its Return On Capital Employed (ROCE), as that will inform our view of the quality of the business.
First of all, we'll work out how to calculate ROCE. Then we'll compare its ROCE to similar companies. Then we'll determine how its current liabilities are affecting its ROCE.
What is Return On Capital Employed (ROCE)?
ROCE is a measure of a company's yearly pre-tax profit (its return), relative to the capital employed in the business. All else being equal, a better business will have a higher ROCE. Overall, it is a valuable metric that has its flaws. Author Edwin Whiting says to be careful when comparing the ROCE of different businesses, since 'No two businesses are exactly alike.'
How Do You Calculate Return On Capital Employed?
Analysts use this formula to calculate return on capital employed:
Return on Capital Employed = Earnings Before Interest and Tax (EBIT) ÷ (Total Assets - Current Liabilities)
Or for IAR Systems Group:
0.20 = kr116m ÷ (kr722m - kr140m) (Based on the trailing twelve months to December 2018.)
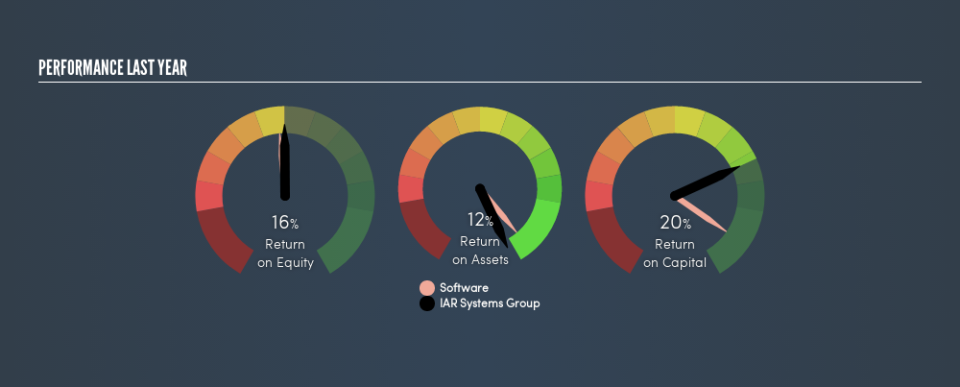
So, IAR Systems Group has an ROCE of 20%.
Check out our latest analysis for IAR Systems Group
Does IAR Systems Group Have A Good ROCE?
When making comparisons between similar businesses, investors may find ROCE useful. IAR Systems Group's ROCE appears to be substantially greater than the 16% average in the Software industry. I think that's good to see, since it implies the company is better than other companies at making the most of its capital. Regardless of the industry comparison, in absolute terms, IAR Systems Group's ROCE currently appears to be excellent.
As we can see, IAR Systems Group currently has an ROCE of 20%, less than the 27% it reported 3 years ago. Therefore we wonder if the company is facing new headwinds.
When considering this metric, keep in mind that it is backwards looking, and not necessarily predictive. ROCE can be deceptive for cyclical businesses, as returns can look incredible in boom times, and terribly low in downturns. ROCE is, after all, simply a snap shot of a single year. What happens in the future is pretty important for investors, so we have prepared a free report on analyst forecasts for IAR Systems Group.
Do IAR Systems Group's Current Liabilities Skew Its ROCE?
Short term (or current) liabilities, are things like supplier invoices, overdrafts, or tax bills that need to be paid within 12 months. Due to the way ROCE is calculated, a high level of current liabilities makes a company look as though it has less capital employed, and thus can (sometimes unfairly) boost the ROCE. To counteract this, we check if a company has high current liabilities, relative to its total assets.
IAR Systems Group has total liabilities of kr140m and total assets of kr722m. As a result, its current liabilities are equal to approximately 19% of its total assets. The fairly low level of current liabilities won't have much impact on the already great ROCE.
Our Take On IAR Systems Group's ROCE
This is good to see, and with such a high ROCE, IAR Systems Group may be worth a closer look. Of course you might be able to find a better stock than IAR Systems Group. So you may wish to see this free collection of other companies that have grown earnings strongly.
If you are like me, then you will not want to miss this free list of growing companies that insiders are buying.
We aim to bring you long-term focused research analysis driven by fundamental data. Note that our analysis may not factor in the latest price-sensitive company announcements or qualitative material.
If you spot an error that warrants correction, please contact the editor at editorial-team@simplywallst.com. This article by Simply Wall St is general in nature. It does not constitute a recommendation to buy or sell any stock, and does not take account of your objectives, or your financial situation. Simply Wall St has no position in the stocks mentioned. Thank you for reading.
