Is IDEXX Laboratories, Inc.'s (NASDAQ:IDXX) High P/E Ratio A Problem For Investors?

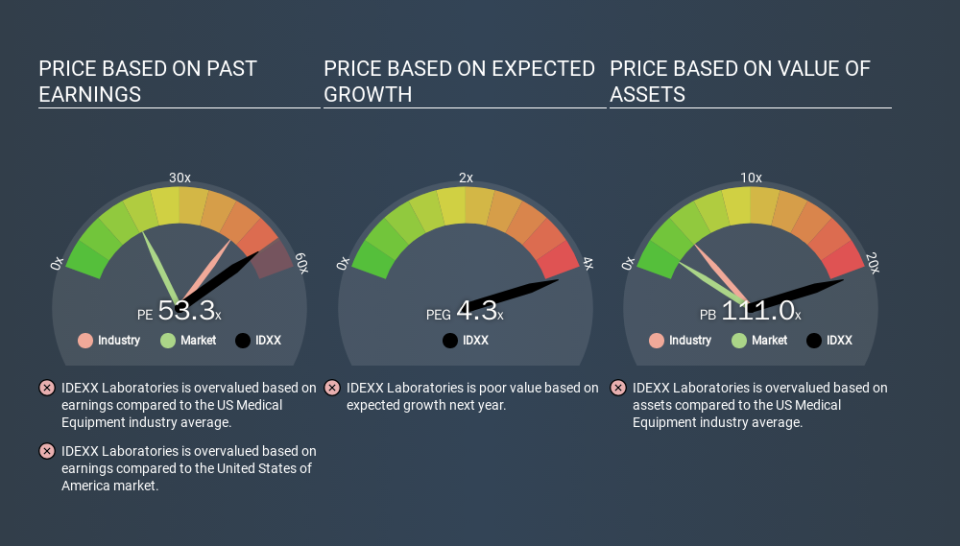
This article is written for those who want to get better at using price to earnings ratios (P/E ratios). We'll apply a basic P/E ratio analysis to IDEXX Laboratories, Inc.'s (NASDAQ:IDXX), to help you decide if the stock is worth further research. Looking at earnings over the last twelve months, IDEXX Laboratories has a P/E ratio of 53.35. That is equivalent to an earnings yield of about 1.9%.
Check out our latest analysis for IDEXX Laboratories
How Do I Calculate IDEXX Laboratories's Price To Earnings Ratio?
The formula for price to earnings is:
Price to Earnings Ratio = Share Price ÷ Earnings per Share (EPS)
Or for IDEXX Laboratories:
P/E of 53.35 = $261.55 ÷ $4.90 (Based on the trailing twelve months to September 2019.)
Is A High P/E Ratio Good?
The higher the P/E ratio, the higher the price tag of a business, relative to its trailing earnings. That isn't necessarily good or bad, but a high P/E implies relatively high expectations of what a company can achieve in the future.
Does IDEXX Laboratories Have A Relatively High Or Low P/E For Its Industry?
The P/E ratio indicates whether the market has higher or lower expectations of a company. As you can see below, IDEXX Laboratories has a higher P/E than the average company (45.8) in the medical equipment industry.
Its relatively high P/E ratio indicates that IDEXX Laboratories shareholders think it will perform better than other companies in its industry classification. The market is optimistic about the future, but that doesn't guarantee future growth. So further research is always essential. I often monitor director buying and selling.
How Growth Rates Impact P/E Ratios
Generally speaking the rate of earnings growth has a profound impact on a company's P/E multiple. When earnings grow, the 'E' increases, over time. That means unless the share price increases, the P/E will reduce in a few years. A lower P/E should indicate the stock is cheap relative to others -- and that may attract buyers.
It's nice to see that IDEXX Laboratories grew EPS by a stonking 30% in the last year. And it has bolstered its earnings per share by 20% per year over the last five years. So we'd generally expect it to have a relatively high P/E ratio.
Don't Forget: The P/E Does Not Account For Debt or Bank Deposits
It's important to note that the P/E ratio considers the market capitalization, not the enterprise value. Thus, the metric does not reflect cash or debt held by the company. In theory, a company can lower its future P/E ratio by using cash or debt to invest in growth.
Such expenditure might be good or bad, in the long term, but the point here is that the balance sheet is not reflected by this ratio.
How Does IDEXX Laboratories's Debt Impact Its P/E Ratio?
IDEXX Laboratories's net debt is 3.7% of its market cap. It would probably trade on a higher P/E ratio if it had a lot of cash, but I doubt it is having a big impact.
The Verdict On IDEXX Laboratories's P/E Ratio
IDEXX Laboratories's P/E is 53.3 which is above average (18.9) in its market. The company is not overly constrained by its modest debt levels, and its recent EPS growth very solid. Therefore, it's not particularly surprising that it has a above average P/E ratio.
Investors have an opportunity when market expectations about a stock are wrong. People often underestimate remarkable growth -- so investors can make money when fast growth is not fully appreciated. So this free report on the analyst consensus forecasts could help you make a master move on this stock.
You might be able to find a better buy than IDEXX Laboratories. If you want a selection of possible winners, check out this free list of interesting companies that trade on a P/E below 20 (but have proven they can grow earnings).
If you spot an error that warrants correction, please contact the editor at editorial-team@simplywallst.com. This article by Simply Wall St is general in nature. It does not constitute a recommendation to buy or sell any stock, and does not take account of your objectives, or your financial situation. Simply Wall St has no position in the stocks mentioned.
We aim to bring you long-term focused research analysis driven by fundamental data. Note that our analysis may not factor in the latest price-sensitive company announcements or qualitative material. Thank you for reading.
