IG Design Group Plc’s (LON:IGR) Earnings Grew 40.36%, Did It Beat Long-Term Trend?

For long-term investors, assessing earnings trend over time and against industry benchmarks is more beneficial than examining a single earnings announcement at a point in time. Investors may find my commentary, albeit very high-level and brief, on IG Design Group Plc (LON:IGR) useful as an attempt to give more color around how IG Design Group is currently performing. Check out our latest analysis for IG Design Group
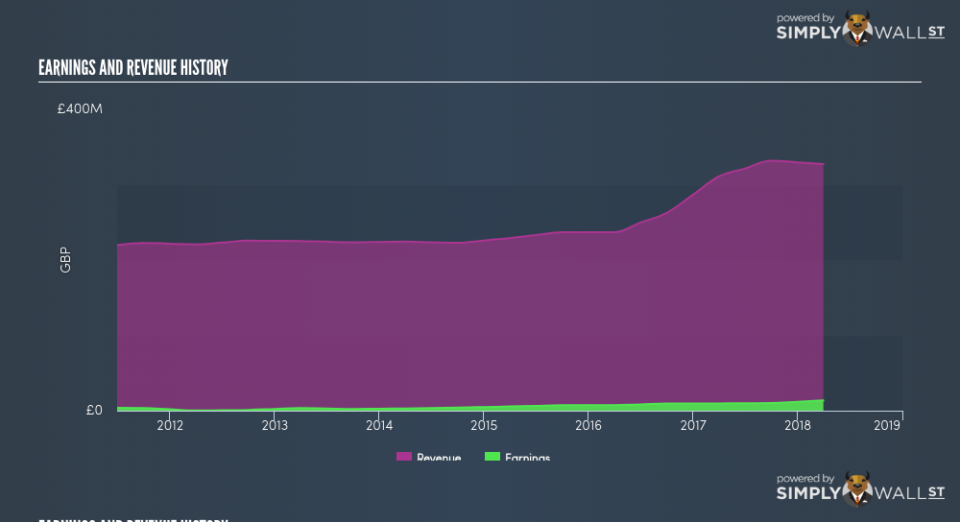
Commentary On IGR’s Past Performance
IGR’s trailing twelve-month earnings (from 31 March 2018) of UK£13.55m has jumped 40.36% compared to the previous year. Furthermore, this one-year growth rate has exceeded its 5-year annual growth average of 29.56%, indicating the rate at which IGR is growing has accelerated. What’s enabled this growth? Let’s take a look at whether it is merely owing to an industry uplift, or if IG Design Group has experienced some company-specific growth.
In the past couple of years, IG Design Group increased its bottom line faster than revenue by effectively controlling its costs. This has caused a margin expansion and profitability over time. Scanning growth from a sector-level, the UK consumer durables industry has been growing its average earnings by double-digit 18.05% in the past twelve months, and 24.80% over the previous five years. This suggests that whatever tailwind the industry is enjoying, IG Design Group is capable of amplifying this to its advantage.
In terms of returns from investment, IG Design Group has not invested its equity funds well, leading to a 14.26% return on equity (ROE), below the sensible minimum of 20%. Furthermore, its return on assets (ROA) of 8.74% is below the GB Consumer Durables industry of 10.63%, indicating IG Design Group’s are utilized less efficiently. However, its return on capital (ROC), which also accounts for IG Design Group’s debt level, has increased over the past 3 years from 9.11% to 17.76%. This correlates with a decrease in debt holding, with debt-to-equity ratio declining from 80.26% to 4.81% over the past 5 years.
What does this mean?
IG Design Group’s track record can be a valuable insight into its earnings performance, but it certainly doesn’t tell the whole story. Companies that have performed well in the past, such as IG Design Group gives investors conviction. However, the next step would be to assess whether the future looks as optimistic. I suggest you continue to research IG Design Group to get a better picture of the stock by looking at:
Future Outlook: What are well-informed industry analysts predicting for IGR’s future growth? Take a look at our free research report of analyst consensus for IGR’s outlook.
Financial Health: Is IGR’s operations financially sustainable? Balance sheets can be hard to analyze, which is why we’ve done it for you. Check out our financial health checks here.
Other High-Performing Stocks: Are there other stocks that provide better prospects with proven track records? Explore our free list of these great stocks here.
NB: Figures in this article are calculated using data from the trailing twelve months from 31 March 2018. This may not be consistent with full year annual report figures.
To help readers see pass the short term volatility of the financial market, we aim to bring you a long-term focused research analysis purely driven by fundamental data. Note that our analysis does not factor in the latest price sensitive company announcements.
The author is an independent contributor and at the time of publication had no position in the stocks mentioned.
