Has IGO Limited's (ASX:IGO) Impressive Stock Performance Got Anything to Do With Its Fundamentals?
Most readers would already be aware that IGO's (ASX:IGO) stock increased significantly by 64% over the past three months. We wonder if and what role the company's financials play in that price change as a company's long-term fundamentals usually dictate market outcomes. Specifically, we decided to study IGO's ROE in this article.
Return on Equity or ROE is a test of how effectively a company is growing its value and managing investors’ money. In simpler terms, it measures the profitability of a company in relation to shareholder's equity.
View our latest analysis for IGO
How Do You Calculate Return On Equity?
ROE can be calculated by using the formula:
Return on Equity = Net Profit (from continuing operations) ÷ Shareholders' Equity
So, based on the above formula, the ROE for IGO is:
8.1% = AU$155m ÷ AU$1.9b (Based on the trailing twelve months to June 2020).
The 'return' is the yearly profit. So, this means that for every A$1 of its shareholder's investments, the company generates a profit of A$0.08.
What Is The Relationship Between ROE And Earnings Growth?
We have already established that ROE serves as an efficient profit-generating gauge for a company's future earnings. Depending on how much of these profits the company reinvests or "retains", and how effectively it does so, we are then able to assess a company’s earnings growth potential. Assuming all else is equal, companies that have both a higher return on equity and higher profit retention are usually the ones that have a higher growth rate when compared to companies that don't have the same features.
A Side By Side comparison of IGO's Earnings Growth And 8.1% ROE
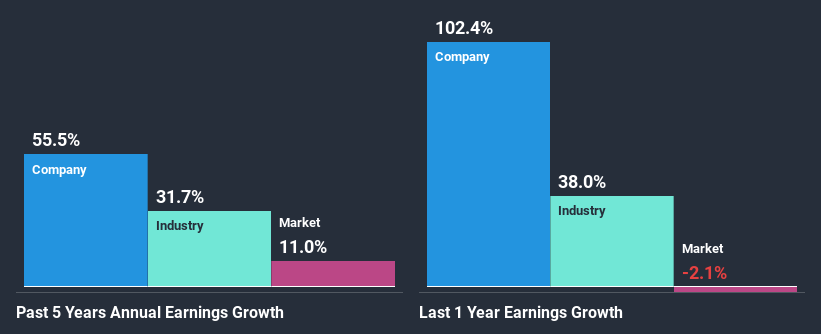
At first glance, IGO's ROE doesn't look very promising. A quick further study shows that the company's ROE doesn't compare favorably to the industry average of 13% either. In spite of this, IGO was able to grow its net income considerably, at a rate of 55% in the last five years. We reckon that there could be other factors at play here. For instance, the company has a low payout ratio or is being managed efficiently.
As a next step, we compared IGO's net income growth with the industry, and pleasingly, we found that the growth seen by the company is higher than the average industry growth of 32%.
The basis for attaching value to a company is, to a great extent, tied to its earnings growth. It’s important for an investor to know whether the market has priced in the company's expected earnings growth (or decline). Doing so will help them establish if the stock's future looks promising or ominous. Is IGO fairly valued compared to other companies? These 3 valuation measures might help you decide.
Is IGO Using Its Retained Earnings Effectively?
IGO has a three-year median payout ratio of 48% (where it is retaining 52% of its income) which is not too low or not too high. So it seems that IGO is reinvesting efficiently in a way that it sees impressive growth in its earnings (discussed above) and pays a dividend that's well covered.
Moreover, IGO is determined to keep sharing its profits with shareholders which we infer from its long history of paying a dividend for at least ten years. Based on the latest analysts' estimates, we found that the company's future payout ratio over the next three years is expected to hold steady at 40%. Therefore, the company's future ROE is also not expected to change by much with analysts predicting an ROE of 7.5%.
Summary
Overall, we feel that IGO certainly does have some positive factors to consider. With a high rate of reinvestment, albeit at a low ROE, the company has managed to see a considerable growth in its earnings. Having said that, the company's earnings growth is expected to slow down, as forecasted in the current analyst estimates. Are these analysts expectations based on the broad expectations for the industry, or on the company's fundamentals? Click here to be taken to our analyst's forecasts page for the company.
This article by Simply Wall St is general in nature. It does not constitute a recommendation to buy or sell any stock, and does not take account of your objectives, or your financial situation. We aim to bring you long-term focused analysis driven by fundamental data. Note that our analysis may not factor in the latest price-sensitive company announcements or qualitative material. Simply Wall St has no position in any stocks mentioned.
Have feedback on this article? Concerned about the content? Get in touch with us directly. Alternatively, email editorial-team (at) simplywallst.com.
