Do You Like iliad S.A. (EPA:ILD) At This P/E Ratio?

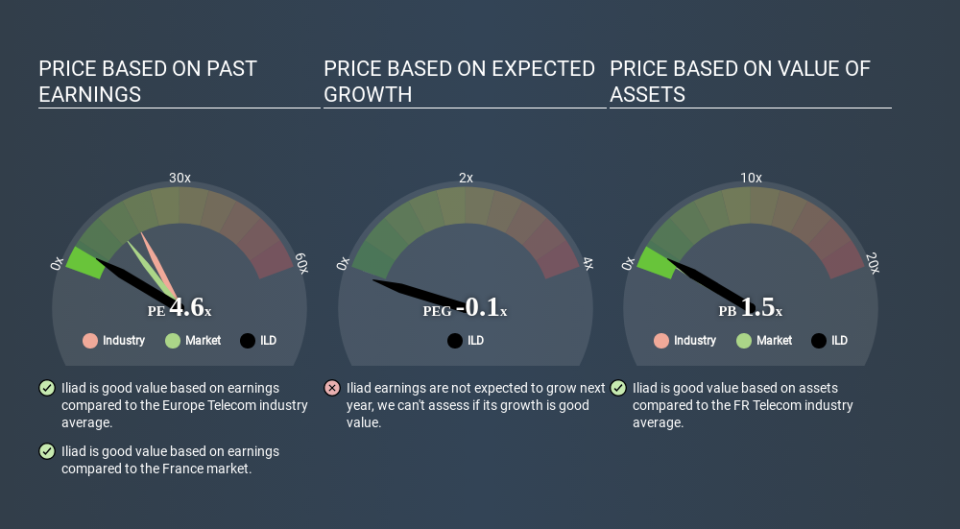
Today, we'll introduce the concept of the P/E ratio for those who are learning about investing. We'll look at iliad S.A.'s (EPA:ILD) P/E ratio and reflect on what it tells us about the company's share price. What is Iliad's P/E ratio? Well, based on the last twelve months it is 4.60. In other words, at today's prices, investors are paying €4.60 for every €1 in prior year profit.
View our latest analysis for Iliad
How Do I Calculate A Price To Earnings Ratio?
The formula for P/E is:
Price to Earnings Ratio = Price per Share ÷ Earnings per Share (EPS)
Or for Iliad:
P/E of 4.60 = €136.250 ÷ €29.591 (Based on the year to December 2019.)
(Note: the above calculation results may not be precise due to rounding.)
Is A High Price-to-Earnings Ratio Good?
A higher P/E ratio implies that investors pay a higher price for the earning power of the business. That isn't necessarily good or bad, but a high P/E implies relatively high expectations of what a company can achieve in the future.
How Does Iliad's P/E Ratio Compare To Its Peers?
The P/E ratio indicates whether the market has higher or lower expectations of a company. If you look at the image below, you can see Iliad has a lower P/E than the average (18.5) in the telecom industry classification.
Its relatively low P/E ratio indicates that Iliad shareholders think it will struggle to do as well as other companies in its industry classification. While current expectations are low, the stock could be undervalued if the situation is better than the market assumes. If you consider the stock interesting, further research is recommended. For example, I often monitor director buying and selling.
How Growth Rates Impact P/E Ratios
Probably the most important factor in determining what P/E a company trades on is the earnings growth. When earnings grow, the 'E' increases, over time. That means unless the share price increases, the P/E will reduce in a few years. And as that P/E ratio drops, the company will look cheap, unless its share price increases.
In the last year, Iliad grew EPS like Taylor Swift grew her fan base back in 2010; the 437% gain was both fast and well deserved. The sweetener is that the annual five year growth rate of 44% is also impressive. So I'd be surprised if the P/E ratio was not above average.
A Limitation: P/E Ratios Ignore Debt and Cash In The Bank
It's important to note that the P/E ratio considers the market capitalization, not the enterprise value. So it won't reflect the advantage of cash, or disadvantage of debt. In theory, a company can lower its future P/E ratio by using cash or debt to invest in growth.
Such expenditure might be good or bad, in the long term, but the point here is that the balance sheet is not reflected by this ratio.
Iliad's Balance Sheet
Iliad's net debt equates to 38% of its market capitalization. You'd want to be aware of this fact, but it doesn't bother us.
The Verdict On Iliad's P/E Ratio
Iliad has a P/E of 4.6. That's below the average in the FR market, which is 13.8. The company does have a little debt, and EPS growth was good last year. If the company can continue to grow earnings, then the current P/E may be unjustifiably low.
Investors should be looking to buy stocks that the market is wrong about. As value investor Benjamin Graham famously said, 'In the short run, the market is a voting machine but in the long run, it is a weighing machine. So this free visualization of the analyst consensus on future earnings could help you make the right decision about whether to buy, sell, or hold.
You might be able to find a better buy than Iliad. If you want a selection of possible winners, check out this free list of interesting companies that trade on a P/E below 20 (but have proven they can grow earnings).
If you spot an error that warrants correction, please contact the editor at editorial-team@simplywallst.com. This article by Simply Wall St is general in nature. It does not constitute a recommendation to buy or sell any stock, and does not take account of your objectives, or your financial situation. Simply Wall St has no position in the stocks mentioned.
We aim to bring you long-term focused research analysis driven by fundamental data. Note that our analysis may not factor in the latest price-sensitive company announcements or qualitative material. Thank you for reading.
