Can You Imagine How Elated Chart Industries' (NYSE:GTLS) Shareholders Feel About Its 786% Share Price Gain?
While stock picking isn't easy, for those willing to persist and learn, it is possible to buy shares in great companies, and generate wonderful returns. When an investor finds a multi-bagger (a stock that goes up over 200%), it makes a big difference to their portfolio. For example, the Chart Industries, Inc. (NYSE:GTLS) share price rocketed moonwards 786% in just one year. It's also good to see the share price up 32% over the last quarter. The company reported its financial results recently; you can catch up on the latest numbers by reading our company report. Looking back further, the stock price is 155% higher than it was three years ago.
Anyone who held for that rewarding ride would probably be keen to talk about it.
Check out our latest analysis for Chart Industries
To paraphrase Benjamin Graham: Over the short term the market is a voting machine, but over the long term it's a weighing machine. One way to examine how market sentiment has changed over time is to look at the interaction between a company's share price and its earnings per share (EPS).
During the last year Chart Industries grew its earnings per share (EPS) by 109%. The share price gain of 786% certainly outpaced the EPS growth. This indicates that the market is now more optimistic about the stock. This favorable sentiment is reflected in its (fairly optimistic) P/E ratio of 75.71.
The graphic below depicts how EPS has changed over time (unveil the exact values by clicking on the image).
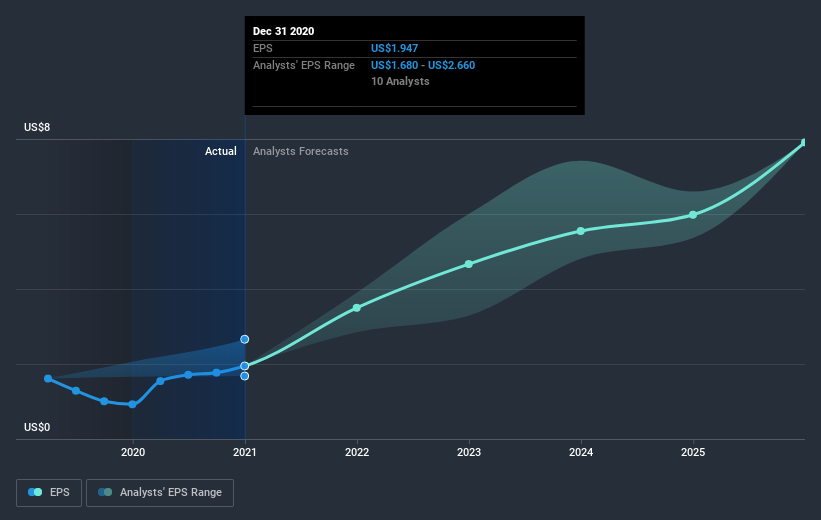
It is of course excellent to see how Chart Industries has grown profits over the years, but the future is more important for shareholders. It might be well worthwhile taking a look at our free report on how its financial position has changed over time.
A Different Perspective
We're pleased to report that Chart Industries shareholders have received a total shareholder return of 786% over one year. That gain is better than the annual TSR over five years, which is 48%. Therefore it seems like sentiment around the company has been positive lately. In the best case scenario, this may hint at some real business momentum, implying that now could be a great time to delve deeper. If you would like to research Chart Industries in more detail then you might want to take a look at whether insiders have been buying or selling shares in the company.
Of course Chart Industries may not be the best stock to buy. So you may wish to see this free collection of growth stocks.
Please note, the market returns quoted in this article reflect the market weighted average returns of stocks that currently trade on US exchanges.
This article by Simply Wall St is general in nature. It does not constitute a recommendation to buy or sell any stock, and does not take account of your objectives, or your financial situation. We aim to bring you long-term focused analysis driven by fundamental data. Note that our analysis may not factor in the latest price-sensitive company announcements or qualitative material. Simply Wall St has no position in any stocks mentioned.
Have feedback on this article? Concerned about the content? Get in touch with us directly. Alternatively, email editorial-team (at) simplywallst.com.
