Imagine Owning Century Enka (NSE:CENTENKA) And Wondering If The 36% Share Price Slide Is Justified

The simplest way to benefit from a rising market is to buy an index fund. But if you buy individual stocks, you can do both better or worse than that. That downside risk was realized by Century Enka Limited (NSE:CENTENKA) shareholders over the last year, as the share price declined 36%. That falls noticeably short of the market return of around -10%. At least the damage isn't so bad if you look at the last three years, since the stock is down 18% in that time. The falls have accelerated recently, with the share price down 21% in the last three months. This could be related to the recent financial results - you can catch up on the most recent data by reading our company report.
See our latest analysis for Century Enka
To paraphrase Benjamin Graham: Over the short term the market is a voting machine, but over the long term it's a weighing machine. One way to examine how market sentiment has changed over time is to look at the interaction between a company's share price and its earnings per share (EPS).
Unfortunately Century Enka reported an EPS drop of 16% for the last year. The share price decline of 36% is actually more than the EPS drop. This suggests the EPS fall has made some shareholders are more nervous about the business. The less favorable sentiment is reflected in its current P/E ratio of 5.36.
The graphic below depicts how EPS has changed over time (unveil the exact values by clicking on the image).
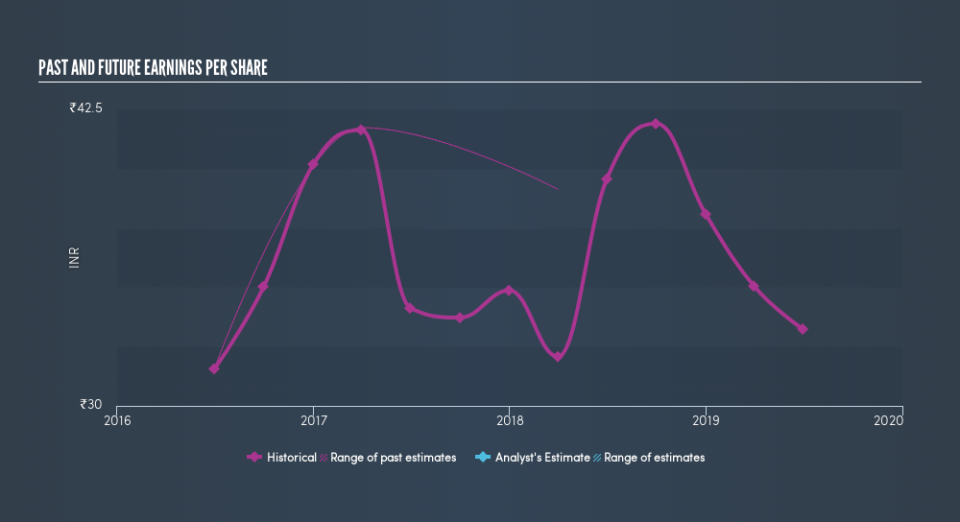
This free interactive report on Century Enka's earnings, revenue and cash flow is a great place to start, if you want to investigate the stock further.
What About Dividends?
As well as measuring the share price return, investors should also consider the total shareholder return (TSR). The TSR incorporates the value of any spin-offs or discounted capital raisings, along with any dividends, based on the assumption that the dividends are reinvested. It's fair to say that the TSR gives a more complete picture for stocks that pay a dividend. As it happens, Century Enka's TSR for the last year was -34%, which exceeds the share price return mentioned earlier. And there's no prize for guessing that the dividend payments largely explain the divergence!
A Different Perspective
We regret to report that Century Enka shareholders are down 34% for the year (even including dividends). Unfortunately, that's worse than the broader market decline of 10%. Having said that, it's inevitable that some stocks will be oversold in a falling market. The key is to keep your eyes on the fundamental developments. On the bright side, long term shareholders have made money, with a gain of 3.5% per year over half a decade. It could be that the recent sell-off is an opportunity, so it may be worth checking the fundamental data for signs of a long term growth trend. Keeping this in mind, a solid next step might be to take a look at Century Enka's dividend track record. This free interactive graph is a great place to start.
Of course Century Enka may not be the best stock to buy. So you may wish to see this free collection of growth stocks.
Please note, the market returns quoted in this article reflect the market weighted average returns of stocks that currently trade on IN exchanges.
We aim to bring you long-term focused research analysis driven by fundamental data. Note that our analysis may not factor in the latest price-sensitive company announcements or qualitative material.
If you spot an error that warrants correction, please contact the editor at editorial-team@simplywallst.com. This article by Simply Wall St is general in nature. It does not constitute a recommendation to buy or sell any stock, and does not take account of your objectives, or your financial situation. Simply Wall St has no position in the stocks mentioned. Thank you for reading.
