Imagine Owning Clearfield (NASDAQ:CLFD) And Wondering If The 34% Share Price Slide Is Justified

For many investors, the main point of stock picking is to generate higher returns than the overall market. But the risk of stock picking is that you will likely buy under-performing companies. Unfortunately, that's been the case for longer term Clearfield, Inc. (NASDAQ:CLFD) shareholders, since the share price is down 34% in the last three years, falling well short of the market return of around 46%. Shareholders have had an even rougher run lately, with the share price down 11% in the last 90 days.
Check out our latest analysis for Clearfield
To quote Buffett, 'Ships will sail around the world but the Flat Earth Society will flourish. There will continue to be wide discrepancies between price and value in the marketplace...' By comparing earnings per share (EPS) and share price changes over time, we can get a feel for how investor attitudes to a company have morphed over time.
During the three years that the share price fell, Clearfield's earnings per share (EPS) dropped by 12% each year. So do you think it's a coincidence that the share price has dropped 13% per year, a very similar rate to the EPS? We don't. So it seems like sentiment towards the stock hasn't changed all that much over time. It seems like the share price is reflecting the declining earnings per share.
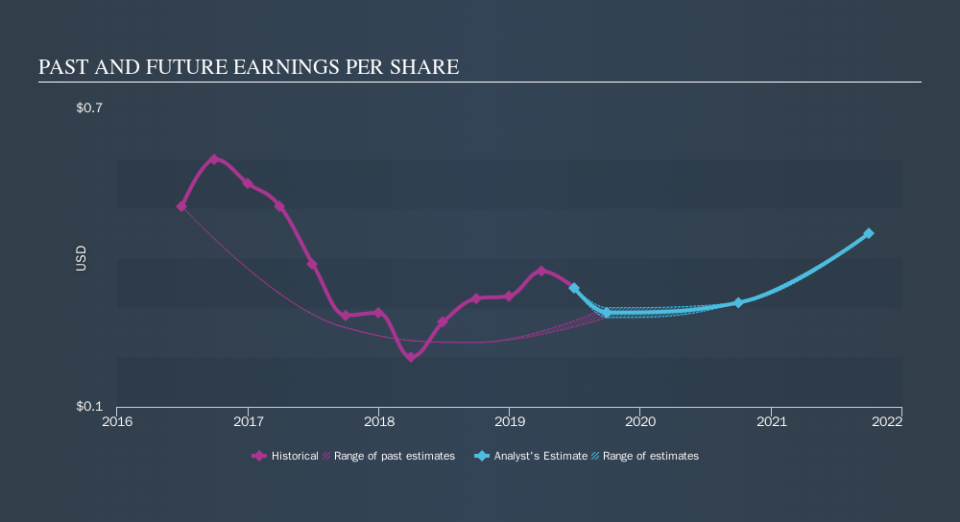
The company's earnings per share (over time) is depicted in the image below (click to see the exact numbers).
We're pleased to report that the CEO is remunerated more modestly than most CEOs at similarly capitalized companies. But while CEO remuneration is always worth checking, the really important question is whether the company can grow earnings going forward. Before buying or selling a stock, we always recommend a close examination of historic growth trends, available here..
A Different Perspective
While the broader market gained around 9.3% in the last year, Clearfield shareholders lost 3.0%. However, keep in mind that even the best stocks will sometimes underperform the market over a twelve month period. Unfortunately, last year's performance may indicate unresolved challenges, given that it was worse than the annualised loss of 2.9% over the last half decade. Generally speaking long term share price weakness can be a bad sign, though contrarian investors might want to research the stock in hope of a turnaround. Before deciding if you like the current share price, check how Clearfield scores on these 3 valuation metrics.
But note: Clearfield may not be the best stock to buy. So take a peek at this free list of interesting companies with past earnings growth (and further growth forecast).
Please note, the market returns quoted in this article reflect the market weighted average returns of stocks that currently trade on US exchanges.
We aim to bring you long-term focused research analysis driven by fundamental data. Note that our analysis may not factor in the latest price-sensitive company announcements or qualitative material.
If you spot an error that warrants correction, please contact the editor at editorial-team@simplywallst.com. This article by Simply Wall St is general in nature. It does not constitute a recommendation to buy or sell any stock, and does not take account of your objectives, or your financial situation. Simply Wall St has no position in the stocks mentioned. Thank you for reading.
