Can You Imagine How Quest Diagnostics's (NYSE:DGX) Shareholders Feel About The 62% Share Price Increase?

When we invest, we're generally looking for stocks that outperform the market average. Buying under-rated businesses is one path to excess returns. For example, long term Quest Diagnostics Incorporated (NYSE:DGX) shareholders have enjoyed a 62% share price rise over the last half decade, well in excess of the market return of around 38% (not including dividends).
View our latest analysis for Quest Diagnostics
There is no denying that markets are sometimes efficient, but prices do not always reflect underlying business performance. One flawed but reasonable way to assess how sentiment around a company has changed is to compare the earnings per share (EPS) with the share price.
During five years of share price growth, Quest Diagnostics actually saw its EPS drop 0.3% per year. So it's hard to argue that the earnings per share are the best metric to judge the company, as it may not be optimized for profits at this point. Since the change in EPS doesn't seem to correlate with the change in share price, it's worth taking a look at other metrics.
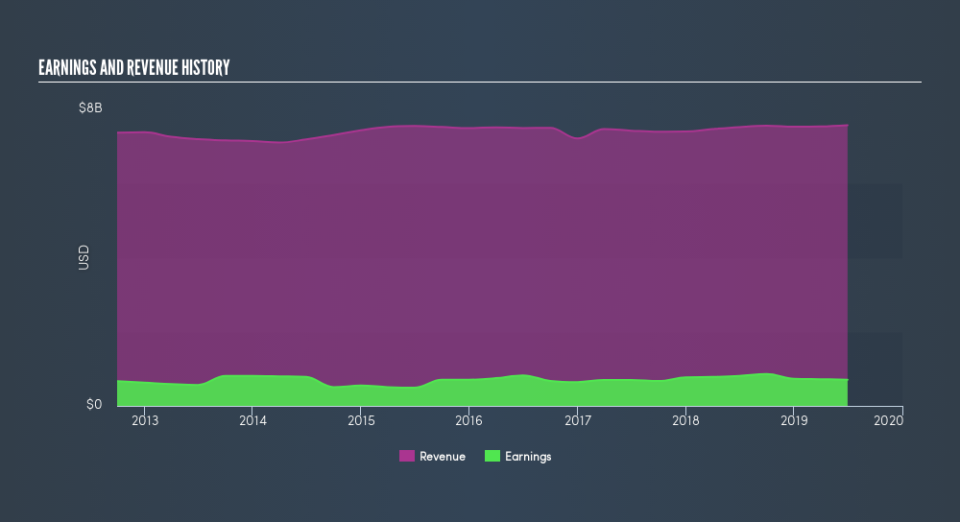
The revenue growth of 0.4% per year hardly seems impressive. So it seems one might have to take closer look at earnings and revenue trends to see how they might influence the share price.
You can see how earnings and revenue have changed over time in the image below (click on the chart to see the exact values).
Quest Diagnostics is a well known stock, with plenty of analyst coverage, suggesting some visibility into future growth. Given we have quite a good number of analyst forecasts, it might be well worth checking out this free chart depicting consensus estimates.
What About Dividends?
As well as measuring the share price return, investors should also consider the total shareholder return (TSR). The TSR incorporates the value of any spin-offs or discounted capital raisings, along with any dividends, based on the assumption that the dividends are reinvested. Arguably, the TSR gives a more comprehensive picture of the return generated by a stock. As it happens, Quest Diagnostics's TSR for the last 5 years was 80%, which exceeds the share price return mentioned earlier. This is largely a result of its dividend payments!
A Different Perspective
Investors in Quest Diagnostics had a tough year, with a total loss of 5.4% (including dividends), against a market gain of about 2.2%. Even the share prices of good stocks drop sometimes, but we want to see improvements in the fundamental metrics of a business, before getting too interested. Longer term investors wouldn't be so upset, since they would have made 12%, each year, over five years. It could be that the recent sell-off is an opportunity, so it may be worth checking the fundamental data for signs of a long term growth trend. Is Quest Diagnostics cheap compared to other companies? These 3 valuation measures might help you decide.
Of course, you might find a fantastic investment by looking elsewhere. So take a peek at this free list of companies we expect will grow earnings.
Please note, the market returns quoted in this article reflect the market weighted average returns of stocks that currently trade on US exchanges.
We aim to bring you long-term focused research analysis driven by fundamental data. Note that our analysis may not factor in the latest price-sensitive company announcements or qualitative material.
If you spot an error that warrants correction, please contact the editor at editorial-team@simplywallst.com. This article by Simply Wall St is general in nature. It does not constitute a recommendation to buy or sell any stock, and does not take account of your objectives, or your financial situation. Simply Wall St has no position in the stocks mentioned. Thank you for reading.
