Should You Be Impressed By The GEO Group, Inc.’s (NYSE:GEO) ROE?

Want to participate in a short research study? Help shape the future of investing tools and you could win a $250 gift card!
While some investors are already well versed in financial metrics (hat tip), this article is for those who would like to learn about Return On Equity (ROE) and why it is important. We’ll use ROE to examine The GEO Group, Inc. (NYSE:GEO), by way of a worked example.
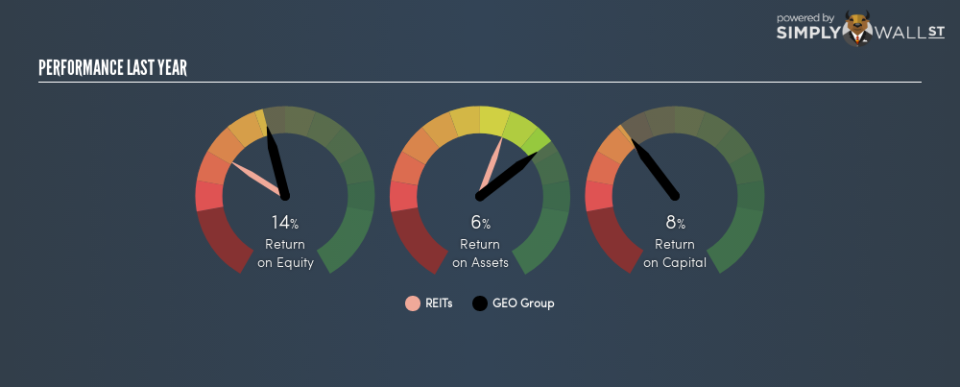
GEO Group has a ROE of 14%, based on the last twelve months. That means that for every $1 worth of shareholders’ equity, it generated $0.14 in profit.
View our latest analysis for GEO Group
How Do I Calculate ROE?
The formula for return on equity is:
Return on Equity = Net Profit ÷ Shareholders’ Equity
Or for GEO Group:
14% = 148.054 ÷ US$1.1b (Based on the trailing twelve months to September 2018.)
Most know that net profit is the total earnings after all expenses, but the concept of shareholders’ equity is a little more complicated. It is all earnings retained by the company, plus any capital paid in by shareholders. You can calculate shareholders’ equity by subtracting the company’s total liabilities from its total assets.
What Does Return On Equity Signify?
Return on Equity measures a company’s profitability against the profit it has kept for the business (plus any capital injections). The ‘return’ is the profit over the last twelve months. That means that the higher the ROE, the more profitable the company is. So, all else equal, investors should like a high ROE. That means it can be interesting to compare the ROE of different companies.
Does GEO Group Have A Good Return On Equity?
By comparing a company’s ROE with its industry average, we can get a quick measure of how good it is. The limitation of this approach is that some companies are quite different from others, even within the same industry classification. As is clear from the image below, GEO Group has a better ROE than the average (6.9%) in the REITs industry.
That’s clearly a positive. In my book, a high ROE almost always warrants a closer look. For example, I often check if insiders have been buying shares .
Why You Should Consider Debt When Looking At ROE
Virtually all companies need money to invest in the business, to grow profits. That cash can come from issuing shares, retained earnings, or debt. In the first and second cases, the ROE will reflect this use of cash for investment in the business. In the latter case, the debt used for growth will improve returns, but won’t affect the total equity. Thus the use of debt can improve ROE, albeit along with extra risk in the case of stormy weather, metaphorically speaking.
Combining GEO Group’s Debt And Its 14% Return On Equity
It’s worth noting the significant use of debt by GEO Group, leading to its debt to equity ratio of 2.54. Its ROE is quite good but, it would have probably been lower without the use of debt. Debt increases risk and reduces options for the company in the future, so you generally want to see some good returns from using it.
In Summary
Return on equity is one way we can compare the business quality of different companies. A company that can achieve a high return on equity without debt could be considered a high quality business. If two companies have the same ROE, then I would generally prefer the one with less debt.
But ROE is just one piece of a bigger puzzle, since high quality businesses often trade on high multiples of earnings. It is important to consider other factors, such as future profit growth — and how much investment is required going forward. So you might want to check this FREE visualization of analyst forecasts for the company.
If you would prefer check out another company — one with potentially superior financials — then do not miss this free list of interesting companies, that have HIGH return on equity and low debt.
To help readers see past the short term volatility of the financial market, we aim to bring you a long-term focused research analysis purely driven by fundamental data. Note that our analysis does not factor in the latest price-sensitive company announcements.
The author is an independent contributor and at the time of publication had no position in the stocks mentioned. For errors that warrant correction please contact the editor at editorial-team@simplywallst.com.
