Individual investors account for 52% of Cochlear Limited's (ASX:COH) ownership, while institutions account for 47%
Every investor in Cochlear Limited (ASX:COH) should be aware of the most powerful shareholder groups. With 52% stake, individual investors possess the maximum shares in the company. Put another way, the group faces the maximum upside potential (or downside risk).
Meanwhile, institutions make up 47% of the company’s shareholders. Institutions will often hold stock in bigger companies, and we expect to see insiders owning a noticeable percentage of the smaller ones.
In the chart below, we zoom in on the different ownership groups of Cochlear.
Check out our latest analysis for Cochlear

What Does The Institutional Ownership Tell Us About Cochlear?
Many institutions measure their performance against an index that approximates the local market. So they usually pay more attention to companies that are included in major indices.
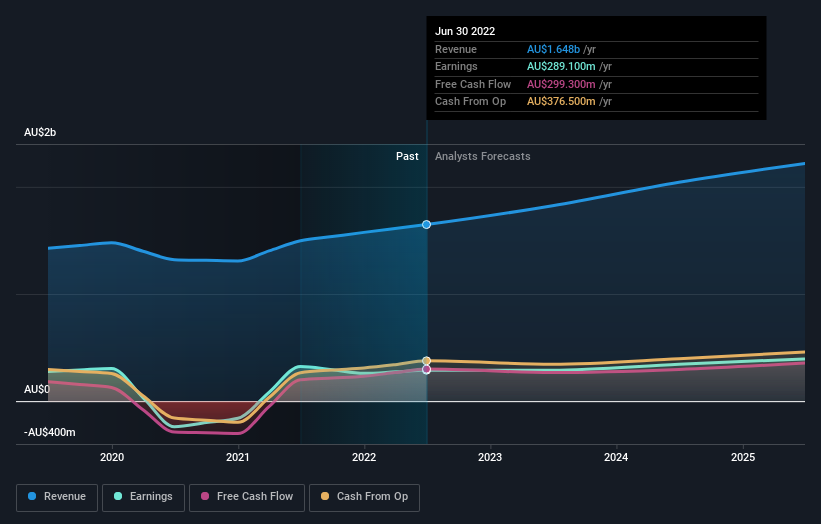
Cochlear already has institutions on the share registry. Indeed, they own a respectable stake in the company. This implies the analysts working for those institutions have looked at the stock and they like it. But just like anyone else, they could be wrong. If multiple institutions change their view on a stock at the same time, you could see the share price drop fast. It's therefore worth looking at Cochlear's earnings history below. Of course, the future is what really matters.
We note that hedge funds don't have a meaningful investment in Cochlear. Looking at our data, we can see that the largest shareholder is BlackRock, Inc. with 6.5% of shares outstanding. For context, the second largest shareholder holds about 5.7% of the shares outstanding, followed by an ownership of 5.5% by the third-largest shareholder.
On studying our ownership data, we found that 25 of the top shareholders collectively own less than 50% of the share register, implying that no single individual has a majority interest.
While studying institutional ownership for a company can add value to your research, it is also a good practice to research analyst recommendations to get a deeper understand of a stock's expected performance. Quite a few analysts cover the stock, so you could look into forecast growth quite easily.
Insider Ownership Of Cochlear
The definition of an insider can differ slightly between different countries, but members of the board of directors always count. Management ultimately answers to the board. However, it is not uncommon for managers to be executive board members, especially if they are a founder or the CEO.
Insider ownership is positive when it signals leadership are thinking like the true owners of the company. However, high insider ownership can also give immense power to a small group within the company. This can be negative in some circumstances.
Our information suggests that Cochlear Limited insiders own under 1% of the company. It is a very large company, so it would be surprising to see insiders own a large proportion of the company. Though their holding amounts to less than 1%, we can see that board members collectively own AU$59m worth of shares (at current prices). It is always good to see at least some insider ownership, but it might be worth checking if those insiders have been selling.
General Public Ownership
The general public, mostly comprising of individual investors, collectively holds 52% of Cochlear shares. With this amount of ownership, retail investors can collectively play a role in decisions that affect shareholder returns, such as dividend policies and the appointment of directors. They can also exercise the power to vote on acquisitions or mergers that may not improve profitability.
Next Steps:
It's always worth thinking about the different groups who own shares in a company. But to understand Cochlear better, we need to consider many other factors.
I like to dive deeper into how a company has performed in the past. You can access this interactive graph of past earnings, revenue and cash flow, for free.
If you are like me, you may want to think about whether this company will grow or shrink. Luckily, you can check this free report showing analyst forecasts for its future.
NB: Figures in this article are calculated using data from the last twelve months, which refer to the 12-month period ending on the last date of the month the financial statement is dated. This may not be consistent with full year annual report figures.
Have feedback on this article? Concerned about the content? Get in touch with us directly. Alternatively, email editorial-team (at) simplywallst.com.
This article by Simply Wall St is general in nature. We provide commentary based on historical data and analyst forecasts only using an unbiased methodology and our articles are not intended to be financial advice. It does not constitute a recommendation to buy or sell any stock, and does not take account of your objectives, or your financial situation. We aim to bring you long-term focused analysis driven by fundamental data. Note that our analysis may not factor in the latest price-sensitive company announcements or qualitative material. Simply Wall St has no position in any stocks mentioned.
Join A Paid User Research Session
You’ll receive a US$30 Amazon Gift card for 1 hour of your time while helping us build better investing tools for the individual investors like yourself. Sign up here
