Do You Like Innophos Holdings, Inc. (NASDAQ:IPHS) At This P/E Ratio?

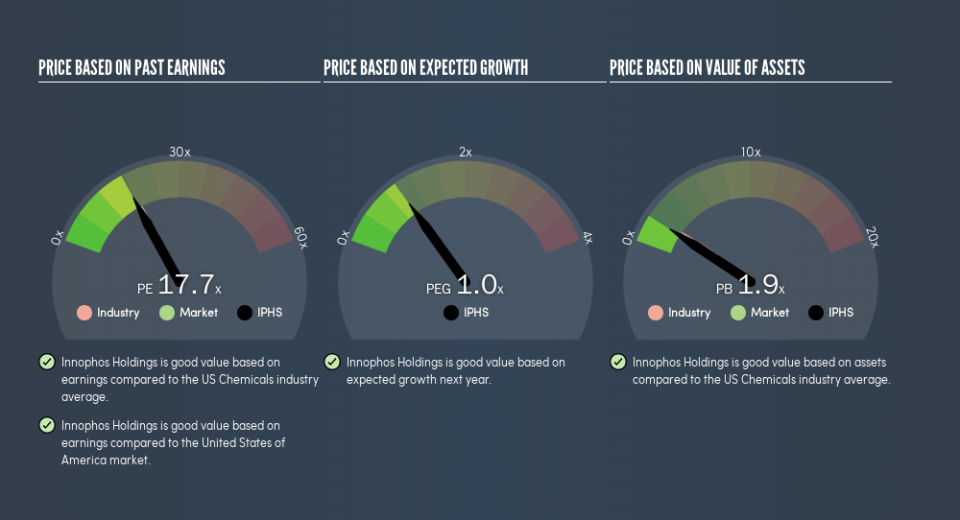
This article is for investors who would like to improve their understanding of price to earnings ratios (P/E ratios). We'll show how you can use Innophos Holdings, Inc.'s (NASDAQ:IPHS) P/E ratio to inform your assessment of the investment opportunity. Innophos Holdings has a P/E ratio of 17.71, based on the last twelve months. That is equivalent to an earnings yield of about 5.6%.
View our latest analysis for Innophos Holdings
How Do You Calculate A P/E Ratio?
The formula for price to earnings is:
Price to Earnings Ratio = Price per Share ÷ Earnings per Share (EPS)
Or for Innophos Holdings:
P/E of 17.71 = $32.61 ÷ $1.84 (Based on the year to December 2018.)
Is A High Price-to-Earnings Ratio Good?
A higher P/E ratio means that investors are paying a higher price for each $1 of company earnings. That isn't necessarily good or bad, but a high P/E implies relatively high expectations of what a company can achieve in the future.
How Growth Rates Impact P/E Ratios
P/E ratios primarily reflect market expectations around earnings growth rates. When earnings grow, the 'E' increases, over time. And in that case, the P/E ratio itself will drop rather quickly. Then, a lower P/E should attract more buyers, pushing the share price up.
In the last year, Innophos Holdings grew EPS like Taylor Swift grew her fan base back in 2010; the 60% gain was both fast and well deserved. Having said that, if we look back three years, EPS growth has averaged a comparatively less impressive 12%. Unfortunately, earnings per share are down 4.0% a year, over 5 years.
Does Innophos Holdings Have A Relatively High Or Low P/E For Its Industry?
The P/E ratio indicates whether the market has higher or lower expectations of a company. As you can see below Innophos Holdings has a P/E ratio that is fairly close for the average for the chemicals industry, which is 18.7.
That indicates that the market expects Innophos Holdings will perform roughly in line with other companies in its industry. If the company has better than average prospects, then the market might be underestimating it. I inform my view byby checking management tenure and remuneration, among other things.
Don't Forget: The P/E Does Not Account For Debt or Bank Deposits
It's important to note that the P/E ratio considers the market capitalization, not the enterprise value. That means it doesn't take debt or cash into account. The exact same company would hypothetically deserve a higher P/E ratio if it had a strong balance sheet, than if it had a weak one with lots of debt, because a cashed up company can spend on growth.
While growth expenditure doesn't always pay off, the point is that it is a good option to have; but one that the P/E ratio ignores.
How Does Innophos Holdings's Debt Impact Its P/E Ratio?
Innophos Holdings's net debt equates to 44% of its market capitalization. You'd want to be aware of this fact, but it doesn't bother us.
The Bottom Line On Innophos Holdings's P/E Ratio
Innophos Holdings's P/E is 17.7 which is about average (18.2) in the US market. When you consider the impressive EPS growth last year (along with some debt), it seems the market has questions about whether rapid EPS growth will be sustained. Because analysts are predicting more growth in the future, one might have expected to see a higher P/E ratio. You can taker closer look at the fundamentals, here.
When the market is wrong about a stock, it gives savvy investors an opportunity. If the reality for a company is not as bad as the P/E ratio indicates, then the share price should increase as the market realizes this. So this free visualization of the analyst consensus on future earnings could help you make the right decision about whether to buy, sell, or hold.
You might be able to find a better buy than Innophos Holdings. If you want a selection of possible winners, check out this free list of interesting companies that trade on a P/E below 20 (but have proven they can grow earnings).
We aim to bring you long-term focused research analysis driven by fundamental data. Note that our analysis may not factor in the latest price-sensitive company announcements or qualitative material.
If you spot an error that warrants correction, please contact the editor at editorial-team@simplywallst.com. This article by Simply Wall St is general in nature. It does not constitute a recommendation to buy or sell any stock, and does not take account of your objectives, or your financial situation. Simply Wall St has no position in the stocks mentioned. Thank you for reading.
