Are Insiders Bearish About Universal Display Corporation (NASDAQ:OLED)?

Universal Display Corporation engages in the research, development, and commercialization of organic light emitting diode (OLED) technologies and materials for use in flat panel displays and solid-state lighting applications. Universal Display is one of United States’s large-cap stocks that saw some insider selling over the past three months, with insiders divesting from 18.75k shares during this period. It is widely considered that insider selling stock in their own companies is potentially a bearish signal. The MIT Press (1998) published an article showing that stocks following insider selling underperformed the market by 2.7%. However, it may not be sufficient to base your investment decision merely on these signals. I’ve assessed two potential reasons behind the insiders’ latest motivation to sell their shares.
Check out our latest analysis for Universal Display
Which Insiders Are Selling?
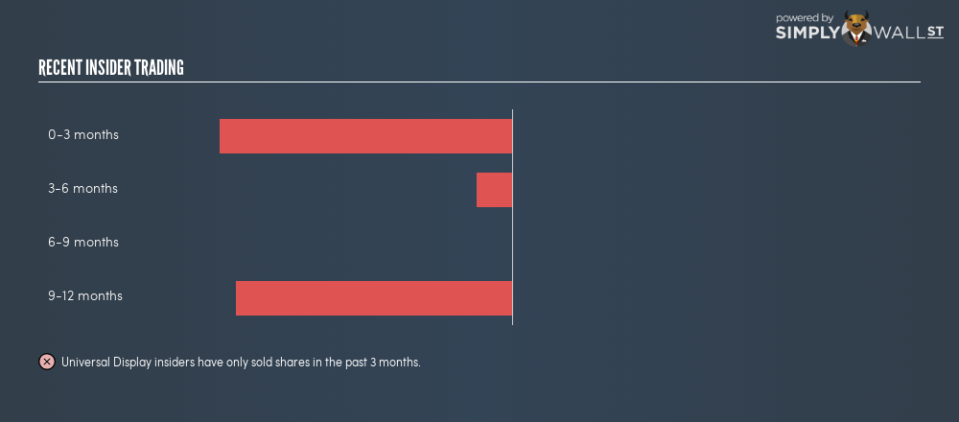
Over the past three months, more shares have been sold than bought by Universal Display’s insiders. In total, individual insiders own over 4.64 million shares in the business, which makes up around 9.85% of total shares outstanding. Latest selling activities involved the following insiders: Lawrence Lacerte and Rosemarie Greco (board member) .
Is Future Growth Outlook As Bearish?

On the surface, analysts’ earnings growth projection of 298% over the next three years provides a very buoyant outlook for the business. However, this is inconsistent with the signal company insiders are sending with their net selling activity. Probing further into annual growth rates, analysts anticipate an impressive double-digit top-line growth next year, which seems to drive high expected earnings growth as well. This could indicate some degree of economies of scale which may have a compounding impact in the future. However, company insiders appear to know something the market doesn’t and have been divesting from the stock. This may mean they believe the impressive growth is hard to maintain or that positive sentiment has led to an inflation of the stock price.
Did Stock Price Volatility Instigate Selling?
Alternatively, the timing of these insider transactions may have been driven by share price volatility. This means, if insiders believe shares were heavily undervalued recently, this would provide a prime opportunity to buy more irrespective of its growth outlook. Within the past three months, Universal Display’s share price traded at a high of $125.3 and a low of $80.75. This suggests a fairly large volatility with a share price movement of 55.17%. This movement is potentially meaningful enough to trade on if insiders believe the market has mispriced their companies’ shares. Or perhaps their reason to sell is not driven by price or growth prospects and merely by the need to diversify their own portfolio holdings.
Next Steps:
Universal Display’s insiders’ meaningful divestments tells us that their shares have recently fallen out of favour, although the positive expected earnings growth challenges this assumption, but the relatively large share price volatility could explain the trade. However, it’s important to keep in mind, insider selling may not necessarily be based on their belief of the company’s ability to perform in the future. Moreover, while insider selling can be a useful prompt, following the lead of an insider, however, will never replace diligent research. I’ve compiled two important aspects you should further examine:
Financial Health: Does Universal Display have a healthy balance sheet? Take a look at our free balance sheet analysis with six simple checks on key factors like leverage and risk.
Other High Quality Alternatives : Are there other high quality stocks you could be holding instead of Universal Display? Explore our interactive list of high quality stocks to get an idea of what else is out there you may be missing!
NB: Figures in this article are calculated using data from the last twelve months, which refer to the 12-month period ending on the last date of the month the financial statement is dated. This may not be consistent with full year annual report figures.
To help readers see past the short term volatility of the financial market, we aim to bring you a long-term focused research analysis purely driven by fundamental data. Note that our analysis does not factor in the latest price-sensitive company announcements.
The author is an independent contributor and at the time of publication had no position in the stocks mentioned. For errors that warrant correction please contact the editor at editorial-team@simplywallst.com.
