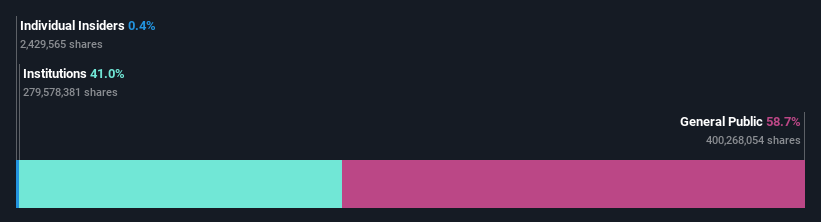
Institutions own 41% of New Gold Inc. (TSE:NGD) shares but individual investors control 59% of the company
A look at the shareholders of New Gold Inc. (TSE:NGD) can tell us which group is most powerful. And the group that holds the biggest piece of the pie are individual investors with 59% ownership. Put another way, the group faces the maximum upside potential (or downside risk).
Meanwhile, institutions make up 41% of the company’s shareholders. Institutions will often hold stock in bigger companies, and we expect to see insiders owning a noticeable percentage of the smaller ones.
Let's take a closer look to see what the different types of shareholders can tell us about New Gold.
Check out our latest analysis for New Gold
What Does The Institutional Ownership Tell Us About New Gold?
Institutional investors commonly compare their own returns to the returns of a commonly followed index. So they generally do consider buying larger companies that are included in the relevant benchmark index.
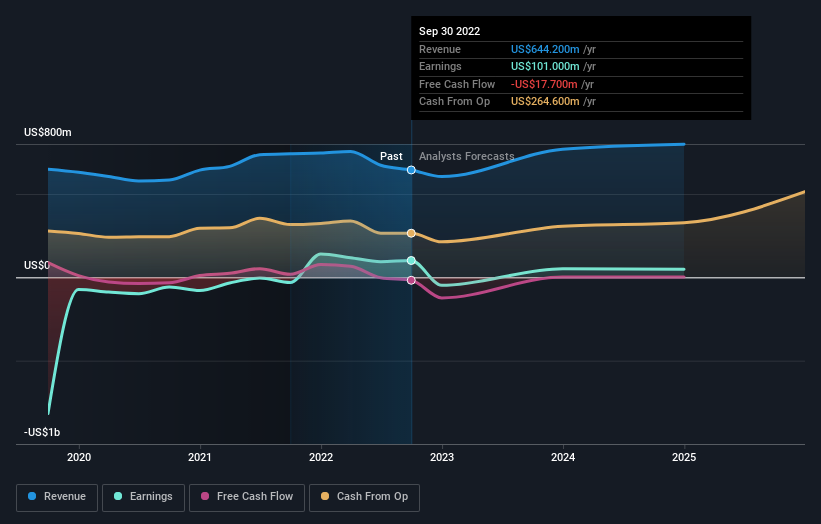
We can see that New Gold does have institutional investors; and they hold a good portion of the company's stock. This can indicate that the company has a certain degree of credibility in the investment community. However, it is best to be wary of relying on the supposed validation that comes with institutional investors. They too, get it wrong sometimes. If multiple institutions change their view on a stock at the same time, you could see the share price drop fast. It's therefore worth looking at New Gold's earnings history below. Of course, the future is what really matters.
Hedge funds don't have many shares in New Gold. The company's largest shareholder is Van Eck Associates Corporation, with ownership of 9.7%. For context, the second largest shareholder holds about 2.6% of the shares outstanding, followed by an ownership of 2.3% by the third-largest shareholder.
On studying our ownership data, we found that 25 of the top shareholders collectively own less than 50% of the share register, implying that no single individual has a majority interest.
While studying institutional ownership for a company can add value to your research, it is also a good practice to research analyst recommendations to get a deeper understand of a stock's expected performance. Quite a few analysts cover the stock, so you could look into forecast growth quite easily.
Insider Ownership Of New Gold
While the precise definition of an insider can be subjective, almost everyone considers board members to be insiders. The company management answer to the board and the latter should represent the interests of shareholders. Notably, sometimes top-level managers are on the board themselves.
Insider ownership is positive when it signals leadership are thinking like the true owners of the company. However, high insider ownership can also give immense power to a small group within the company. This can be negative in some circumstances.
Our data suggests that insiders own under 1% of New Gold Inc. in their own names. It appears that the board holds about CA$3.8m worth of stock. This compares to a market capitalization of CA$1.1b. Many tend to prefer to see a board with bigger shareholdings. A good next step might be to take a look at this free summary of insider buying and selling.
General Public Ownership
The general public -- including retail investors -- own 59% of New Gold. With this amount of ownership, retail investors can collectively play a role in decisions that affect shareholder returns, such as dividend policies and the appointment of directors. They can also exercise the power to vote on acquisitions or mergers that may not improve profitability.
Next Steps:
While it is well worth considering the different groups that own a company, there are other factors that are even more important. For instance, we've identified 1 warning sign for New Gold that you should be aware of.
If you would prefer discover what analysts are predicting in terms of future growth, do not miss this free report on analyst forecasts.
NB: Figures in this article are calculated using data from the last twelve months, which refer to the 12-month period ending on the last date of the month the financial statement is dated. This may not be consistent with full year annual report figures.
Have feedback on this article? Concerned about the content? Get in touch with us directly. Alternatively, email editorial-team (at) simplywallst.com.
This article by Simply Wall St is general in nature. We provide commentary based on historical data and analyst forecasts only using an unbiased methodology and our articles are not intended to be financial advice. It does not constitute a recommendation to buy or sell any stock, and does not take account of your objectives, or your financial situation. We aim to bring you long-term focused analysis driven by fundamental data. Note that our analysis may not factor in the latest price-sensitive company announcements or qualitative material. Simply Wall St has no position in any stocks mentioned.
Join A Paid User Research Session
You’ll receive a US$30 Amazon Gift card for 1 hour of your time while helping us build better investing tools for the individual investors like yourself. Sign up here
