Do Institutions Own Asia Standard International Group Limited (HKG:129) Shares?

A look at the shareholders of Asia Standard International Group Limited (HKG:129) can tell us which group is most powerful. Institutions will often hold stock in bigger companies, and we expect to see insiders owning a noticeable percentage of the smaller ones. Companies that have been privatized tend to have low insider ownership.
With a market capitalization of HK$1.7b, Asia Standard International Group is a small cap stock, so it might not be well known by many institutional investors. In the chart below below, we can see that institutional investors have bought into the company. We can zoom in on the different ownership groups, to learn more about 129.
View our latest analysis for Asia Standard International Group

What Does The Institutional Ownership Tell Us About Asia Standard International Group?
Many institutions measure their performance against an index that approximates the local market. So they usually pay more attention to companies that are included in major indices.
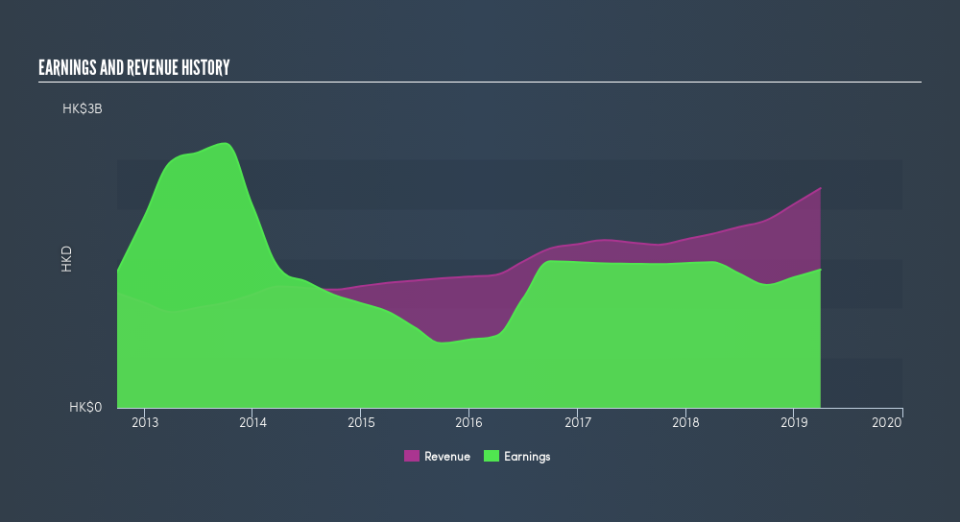
As you can see, institutional investors own 12% of Asia Standard International Group. This suggests some credibility amongst professional investors. But we can't rely on that fact alone, since institutions make bad investments sometimes, just like everyone does. If multiple institutions change their view on a stock at the same time, you could see the share price drop fast. It's therefore worth looking at Asia Standard International Group's earnings history, below. Of course, the future is what really matters.
We note that hedge funds don't have a meaningful investment in Asia Standard International Group. We're not picking up on any analyst coverage of the stock at the moment, so the company is unlikely to be widely held.
Insider Ownership Of Asia Standard International Group
The definition of company insiders can be subjective, and does vary between jurisdictions. Our data reflects individual insiders, capturing board members at the very least. The company management answer to the board; and the latter should represent the interests of shareholders. Notably, sometimes top-level managers are on the board, themselves.
Insider ownership is positive when it signals leadership are thinking like the true owners of the company. However, high insider ownership can also give immense power to a small group within the company. This can be negative in some circumstances.
Our information suggests that Asia Standard International Group Limited insiders own under 1% of the company. However, it's possible that insiders might have an indirect interest through a more complex structure. It appears that the board holds about HK$1.7m worth of stock. This compares to a market capitalization of HK$1.7b. I generally like to see a board more invested. However it might be worth checking if those insiders have been buying.
General Public Ownership
With a 45% ownership, the general public have some degree of sway over 129. While this group can't necessarily call the shots, it can certainly have a real influence on how the company is run.
Private Company Ownership
Our data indicates that Private Companies hold 6.2%, of the company's shares. It might be worth looking deeper into this. If related parties, such as insiders, have an interest in one of these private companies, that should be disclosed in the annual report. Private companies may also have a strategic interest in the company.
Public Company Ownership
It appears to us that public companies own 36% of 129. We can't be certain, but this is quite possible this is a strategic stake. The businesses may be similar, or work together.
Next Steps:
While it is well worth considering the different groups that own a company, there are other factors that are even more important.
I always like to check for a history of revenue growth. You can too, by accessing this free chart of historic revenue and earnings in this detailed graph.
Of course, you might find a fantastic investment by looking elsewhere. So take a peek at this free list of interesting companies.
NB: Figures in this article are calculated using data from the last twelve months, which refer to the 12-month period ending on the last date of the month the financial statement is dated. This may not be consistent with full year annual report figures.
We aim to bring you long-term focused research analysis driven by fundamental data. Note that our analysis may not factor in the latest price-sensitive company announcements or qualitative material.
If you spot an error that warrants correction, please contact the editor at editorial-team@simplywallst.com. This article by Simply Wall St is general in nature. It does not constitute a recommendation to buy or sell any stock, and does not take account of your objectives, or your financial situation. Simply Wall St has no position in the stocks mentioned. Thank you for reading.
