Interested In E Bon Holdings Limited (HKG:599)? Here’s How It Performed Recently

When E Bon Holdings Limited (HKG:599) released its most recent earnings update (30 September 2018), I wanted to understand how these figures stacked up against its past performance. The two benchmarks I used were E. Bon Holdings’s average earnings over the past couple of years, and its industry performance. These are useful yardsticks to help me gauge whether or not 599 actually performed well. Below is a quick commentary on how I see 599 has performed.
Check out our latest analysis for E. Bon Holdings
Commentary On 599’s Past Performance
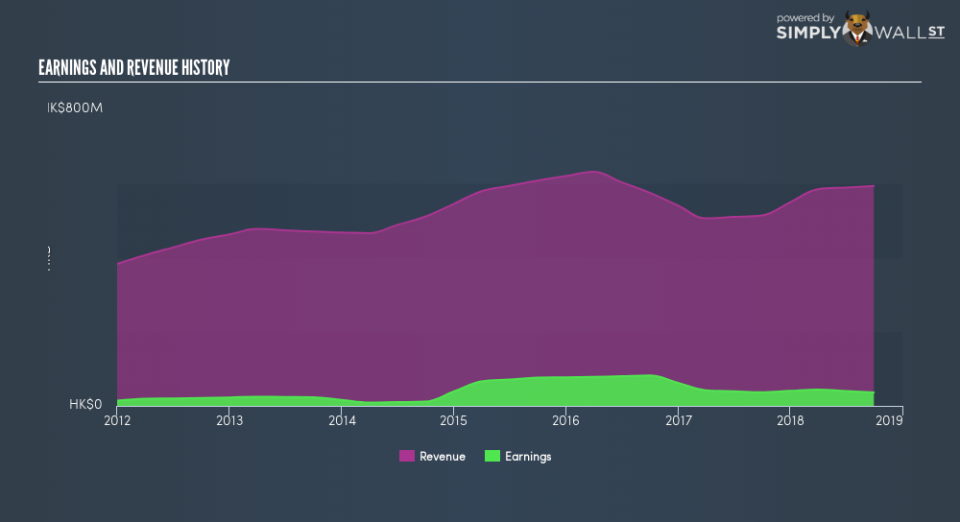
599’s trailing twelve-month earnings (from 30 September 2018) of HK$37m has declined by -0.6% compared to the previous year.
Furthermore, this one-year growth rate has been lower than its average earnings growth rate over the past 5 years of 9.9%, indicating the rate at which 599 is growing has slowed down. Why is this? Well, let’s look at what’s transpiring with margins and if the entire industry is facing the same headwind.
In terms of returns from investment, E. Bon Holdings has fallen short of achieving a 20% return on equity (ROE), recording 7.8% instead. However, its return on assets (ROA) of 5.9% exceeds the HK Trade Distributors industry of 5.8%, indicating E. Bon Holdings has used its assets more efficiently. Though, its return on capital (ROC), which also accounts for E. Bon Holdings’s debt level, has declined over the past 3 years from 22% to 8.2%.
What does this mean?
E. Bon Holdings’s track record can be a valuable insight into its earnings performance, but it certainly doesn’t tell the whole story. In some cases, companies that face an extended period of diminishing earnings are going through some sort of reinvestment phase in order to keep up with the latest industry disruption and growth. You should continue to research E. Bon Holdings to get a better picture of the stock by looking at:
Future Outlook: What are well-informed industry analysts predicting for 599’s future growth? Take a look at our free research report of analyst consensus for 599’s outlook.
Financial Health: Are 599’s operations financially sustainable? Balance sheets can be hard to analyze, which is why we’ve done it for you. Check out our financial health checks here.
Other High-Performing Stocks: Are there other stocks that provide better prospects with proven track records? Explore our free list of these great stocks here.
NB: Figures in this article are calculated using data from the trailing twelve months from 30 September 2018. This may not be consistent with full year annual report figures.
To help readers see past the short term volatility of the financial market, we aim to bring you a long-term focused research analysis purely driven by fundamental data. Note that our analysis does not factor in the latest price-sensitive company announcements.
The author is an independent contributor and at the time of publication had no position in the stocks mentioned. For errors that warrant correction please contact the editor at editorial-team@simplywallst.com.
