Investing in Archer-Daniels-Midland (NYSE:ADM) three years ago would have delivered you a 126% gain
It hasn't been the best quarter for Archer-Daniels-Midland Company (NYSE:ADM) shareholders, since the share price has fallen 16% in that time. But in three years the returns have been great. Indeed, the share price is up a very strong 110% in that time. So the recent fall in the share price should be viewed in that context. The thing to consider is whether the underlying business is doing well enough to support the current price.
So let's investigate and see if the longer term performance of the company has been in line with the underlying business' progress.
Check out our latest analysis for Archer-Daniels-Midland
In his essay The Superinvestors of Graham-and-Doddsville Warren Buffett described how share prices do not always rationally reflect the value of a business. One imperfect but simple way to consider how the market perception of a company has shifted is to compare the change in the earnings per share (EPS) with the share price movement.
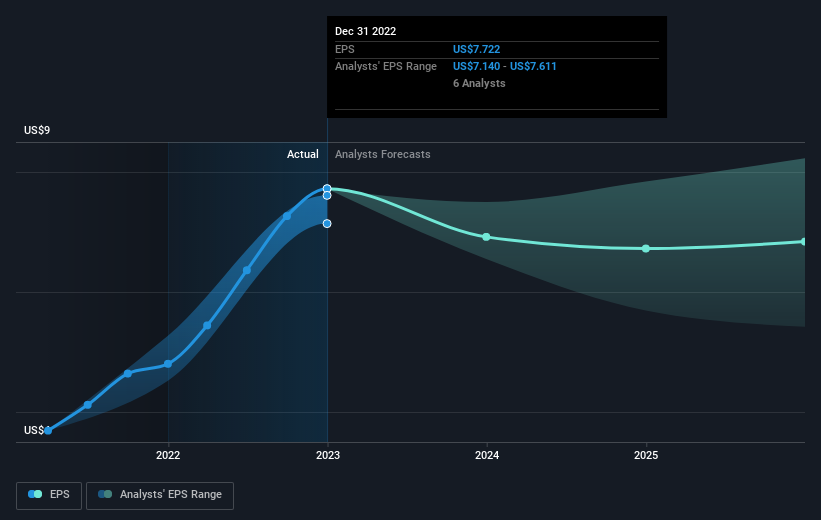
During three years of share price growth, Archer-Daniels-Midland achieved compound earnings per share growth of 48% per year. This EPS growth is higher than the 28% average annual increase in the share price. So one could reasonably conclude that the market has cooled on the stock. We'd venture the lowish P/E ratio of 10.28 also reflects the negative sentiment around the stock.
The image below shows how EPS has tracked over time (if you click on the image you can see greater detail).
We know that Archer-Daniels-Midland has improved its bottom line over the last three years, but what does the future have in store? It might be well worthwhile taking a look at our free report on how its financial position has changed over time.
What About Dividends?
When looking at investment returns, it is important to consider the difference between total shareholder return (TSR) and share price return. The TSR is a return calculation that accounts for the value of cash dividends (assuming that any dividend received was reinvested) and the calculated value of any discounted capital raisings and spin-offs. So for companies that pay a generous dividend, the TSR is often a lot higher than the share price return. We note that for Archer-Daniels-Midland the TSR over the last 3 years was 126%, which is better than the share price return mentioned above. And there's no prize for guessing that the dividend payments largely explain the divergence!
A Different Perspective
It's good to see that Archer-Daniels-Midland has rewarded shareholders with a total shareholder return of 5.8% in the last twelve months. That's including the dividend. However, the TSR over five years, coming in at 17% per year, is even more impressive. The pessimistic view would be that be that the stock has its best days behind it, but on the other hand the price might simply be moderating while the business itself continues to execute. It's always interesting to track share price performance over the longer term. But to understand Archer-Daniels-Midland better, we need to consider many other factors. To that end, you should be aware of the 1 warning sign we've spotted with Archer-Daniels-Midland .
For those who like to find winning investments this free list of growing companies with recent insider purchasing, could be just the ticket.
Please note, the market returns quoted in this article reflect the market weighted average returns of stocks that currently trade on US exchanges.
Have feedback on this article? Concerned about the content? Get in touch with us directly. Alternatively, email editorial-team (at) simplywallst.com.
This article by Simply Wall St is general in nature. We provide commentary based on historical data and analyst forecasts only using an unbiased methodology and our articles are not intended to be financial advice. It does not constitute a recommendation to buy or sell any stock, and does not take account of your objectives, or your financial situation. We aim to bring you long-term focused analysis driven by fundamental data. Note that our analysis may not factor in the latest price-sensitive company announcements or qualitative material. Simply Wall St has no position in any stocks mentioned.
Join A Paid User Research Session
You’ll receive a US$30 Amazon Gift card for 1 hour of your time while helping us build better investing tools for the individual investors like yourself. Sign up here
