Investing in Kazia Therapeutics (ASX:KZA) three years ago would have delivered you a 241% gain
The most you can lose on any stock (assuming you don't use leverage) is 100% of your money. But when you pick a company that is really flourishing, you can make more than 100%. For example, the Kazia Therapeutics Limited (ASX:KZA) share price has soared 226% in the last three years. That sort of return is as solid as granite. It's also up 15% in about a month. We note that Kazia Therapeutics reported its financial results recently; luckily, you can catch up on the latest revenue and profit numbers in our company report.
So let's assess the underlying fundamentals over the last 3 years and see if they've moved in lock-step with shareholder returns.
Check out our latest analysis for Kazia Therapeutics
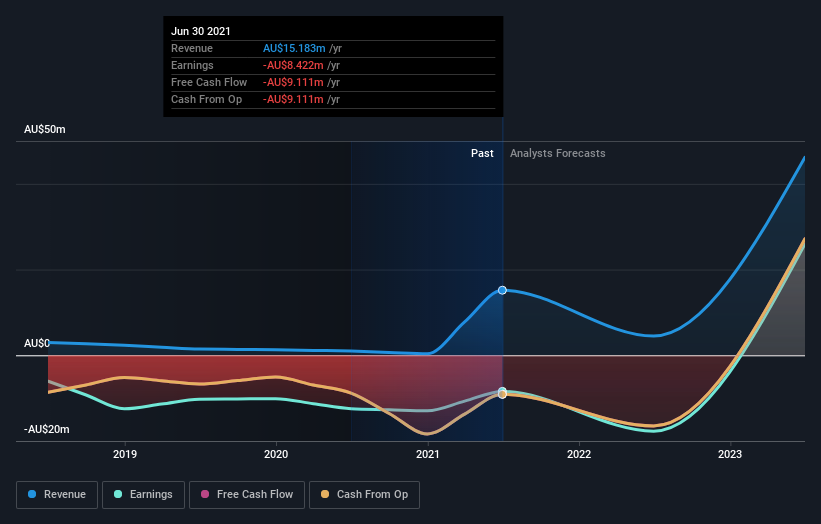
Because Kazia Therapeutics made a loss in the last twelve months, we think the market is probably more focussed on revenue and revenue growth, at least for now. When a company doesn't make profits, we'd generally expect to see good revenue growth. As you can imagine, fast revenue growth, when maintained, often leads to fast profit growth.
Kazia Therapeutics' revenue trended up 61% each year over three years. That's well above most pre-profit companies. Meanwhile, the share price performance has been pretty solid at 48% compound over three years. This suggests the market has recognized the progress the business has made, at least to a significant degree. Nonetheless, we'd say Kazia Therapeutics is still worth investigating - successful businesses can often keep growing for long periods.
The company's revenue and earnings (over time) are depicted in the image below (click to see the exact numbers).
We consider it positive that insiders have made significant purchases in the last year. Having said that, most people consider earnings and revenue growth trends to be a more meaningful guide to the business. You can see what analysts are predicting for Kazia Therapeutics in this interactive graph of future profit estimates.
What about the Total Shareholder Return (TSR)?
We'd be remiss not to mention the difference between Kazia Therapeutics' total shareholder return (TSR) and its share price return. The TSR attempts to capture the value of dividends (as if they were reinvested) as well as any spin-offs or discounted capital raisings offered to shareholders. We note that Kazia Therapeutics' TSR, at 241% is higher than its share price return of 226%. When you consider it hasn't been paying a dividend, this data suggests shareholders have benefitted from a spin-off, or had the opportunity to acquire attractively priced shares in a discounted capital raising.
A Different Perspective
It's nice to see that Kazia Therapeutics shareholders have received a total shareholder return of 54% over the last year. Since the one-year TSR is better than the five-year TSR (the latter coming in at 8% per year), it would seem that the stock's performance has improved in recent times. In the best case scenario, this may hint at some real business momentum, implying that now could be a great time to delve deeper. It's always interesting to track share price performance over the longer term. But to understand Kazia Therapeutics better, we need to consider many other factors. For example, we've discovered 1 warning sign for Kazia Therapeutics that you should be aware of before investing here.
Kazia Therapeutics is not the only stock insiders are buying. So take a peek at this free list of growing companies with insider buying.
Please note, the market returns quoted in this article reflect the market weighted average returns of stocks that currently trade on AU exchanges.
This article by Simply Wall St is general in nature. We provide commentary based on historical data and analyst forecasts only using an unbiased methodology and our articles are not intended to be financial advice. It does not constitute a recommendation to buy or sell any stock, and does not take account of your objectives, or your financial situation. We aim to bring you long-term focused analysis driven by fundamental data. Note that our analysis may not factor in the latest price-sensitive company announcements or qualitative material. Simply Wall St has no position in any stocks mentioned.
Have feedback on this article? Concerned about the content? Get in touch with us directly. Alternatively, email editorial-team (at) simplywallst.com.
