Investor Movement Index April Summary
This article was originally published on TD Ameritrade's IMX page.
Monthly Summary
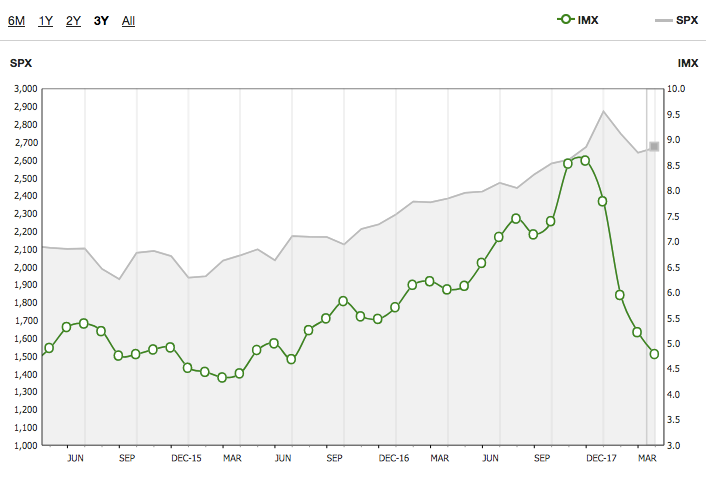
The IMX moved lower for the fourth month in a row, ending the period down 8.24 percent at 4.79.
The April IMX period started out with volatility in equity markets, and the IMX took another dip lower. Continuing their behavior for the past year, TD Ameritrade clients were net buyers during the period. However, many widely held positions saw their volatility relative to the overall equity market decrease once again, causing a decrease in the overall IMX score. Volatility of the S&P 500, as measured by the Cboe Volatility Index, or VIX, averaged over 20 for the first five days of April before subsiding near the end of the period.
April began with equity market volatility, and all three major equity indices moved lower during the first five business days of the month. The S&P 500 traded lower by 2.2 percent during the first day of April, its worst start ever to a second quarter. Markets rebounded during the last three weeks for the period, with the S&P 500 ending the period up 1.10 percent. The NASDAQ Composite Index and Dow Jones Industrial Average also increased during the period, up 0.80 percent and 0.86 percent, respectively. Market volatility was in part driven by global economic concerns following the Trump administration's proposed tariffs on $50 billion of goods from China. Following the market selloff early in the period, the S&P 500 traded at the lowest price-to-earnings ratio in nearly two years compared to expected earnings over the next 12 months, although the metric is still higher than historical averages. Later in the period, geopolitical tensions in Asia seemed to ease and some solid corporate earnings helped push equity markets higher.
Trading
TD Ameritrade clients were net buyers during the April period, buying some volatile names during earnings season. Netflix, Inc. (NASDAQ: NFLX) was net bought for the third month in a row. The company reported better-than-expected earnings during the month, but traded lower after reports it may purchase a movie theatre chain. For the first time in 2018, AT&T Inc. (NYSE: T) was net bought as the company traded lower following an earnings miss due to cord-cutting increases. Spotify Technology SA (NYSE: SPOT) was also a net buy following the company's IPO early in the period. Advanced Micro Devices, Inc. (NASDAQ: AMD), which has seen volatility recently and posted an earnings beat, was net bought. For the fifth month in a row, Amazon.com, Inc. (NASDAQ: AMZN) was net bought. The company traded higher during the period on the back of an earnings beat and analyst upgrades. Square Inc. (NYSE: SQ), which was off approximately 20 percent from recent highs as the company announced an acquisition of another online company, Weebly, was also a net buy.
Additional popular names bought include General Electric Company (NYSE: GE), Alibaba Group Holding Ltd. (NYSE: BABA), and JPMorgan Chase & Co. (NYSE: JPM).
TD Ameritrade clients appeared to take some profits in multiple names during the period. Oil companies were popular sells with ConocoPhillips (NYSE: COP), BP PLC (ADR) (NYSE: BP), National-Oilwell Varco Inc. (NYSE: NOV), and Transocean LTD (NYSE: RIG) all net sold. Oil prices traded near three-year highs on higher global demand and possible OPEC-led production cuts. COP and BP both traded at multi-year highs, while NOV and RIG reached 52-week highs, enticing clients to take profits in all four names. Alcoa Corp. (NYSE: AA) traded at levels not seen since before the financial crisis following proposed tariffs on steel and aluminum, and was net sold. For the third month in a row, Facebook, Inc. (NASDAQ: FB) was net sold after CEO Mark Zuckerberg testified before Congress regarding the misuse of user data and a beat on earnings.
Additional names sold include Starbucks Corporation (NASDAQ: SBUX), Chipotle Mexican Grill (NYSE: CMG), and Frontier Communications Corp. (NASDAQ: FTR).
Inclusion of specific security names in this commentary does not constitute a recommendation from TD Ameritrade to buy, sell, or hold.
Historical Overview
TD Ameritrade's Investor Movement Index (IMX) has generally correlated with the S&P 500 as clients react to equity price movements, but the index has gone through uncorrelated periods. Beginning in January 2010, when TD Ameritrade started tracking the IMX, the index rose with equity markets until April 2010, when it peaked at 5.40. In May 2010 investors experienced the "Flash Crash" and the IMX began a sharp downward trend. The IMX didn't reach 5.00 again until the S&P 500 was well above April 2010 levels.
The index eventually peaked at 5.56 in June 2011. This peak was immediately followed by a plunge in equity markets, and in the IMX, as the media was dominated by the U.S. debt ceiling debate, S&P downgrade of U.S. debt, and European debt concerns. The S&P 500 began to recover in the fall of 2011, but the IMX continued to decline until it reached a new low at the time in January 2012. As the S&P 500 began to sustain an upward trend in early 2012, the IMX started to rise. In 2013, as economic conditions improved and the S&P 500 climbed to record levels, the IMX rose to the high end of its historical range, finishing 2013 at 5.62, and continued to rise in 2014 amid geopolitical tensions related to Ukraine and the Middle East, until seeing slight declines in October and November.
By the middle of 2015, the IMX had seen increases, as equity market volatility had reduced to near historical levels while the market continued its upward trend. As 2015 ended its third quarter, volatility had returned to markets as global economic concerns and speculation around the timing and trajectory of Federal Reserve rate increases seemed to rattle overall equity markets. This uncertainty continued to play a role in the equity markets through the fourth quarter of 2015 and into early 2016. The volatility accompanying this uncertainty abated in the second quarter of 2016 and remained low until late in the third quarter. Just as it had in 2015, the IMX saw increases mid-year during the period of lower volatility. The IMX continued to climb into the fourth quarter reaching 5.83 in October 2016, its highest point in two years. A brief spike in volatility during November, timed around the U.S. presidential election, coincided with a slight pull back in the IMX, which then ended 2016 at the high end of its historical range.
The IMX started 2017 with an upward trend and reaching an all-time high in March, before pausing in April as lower volatility led to a decrease in the IMX. The momentum resumed in May, with the IMX breaching 7.0 for the first time ever in July of 2017. The IMX took another brief pause in September, before following markets higher and breaching 8.0 for the first time ever in November and ending 2017 at an all-time high. Volatility returned to the markets in early 2018, and the IMX decreased for three consecutive months to start the year.
Information from TDA is not intended to be investment advice or construed as a recommendation or endorsement of any particular investment or investment strategy, and is for illustrative purposes only. Be sure to understand all risks involved with each strategy, including commission costs, before attempting to place any trade.
See more from Benzinga
What Investors Are Watching For In This Year's Berkshire Hathaway Meeting
The Fed Hikes Rates Ahead Of Upcoming Financial Sector Earnings
Trade Fears Still Stalking Street As China Announces Potential Retaliation
© 2018 Benzinga.com. Benzinga does not provide investment advice. All rights reserved.
