Investor Movement Index October Summary
Monthly Summary
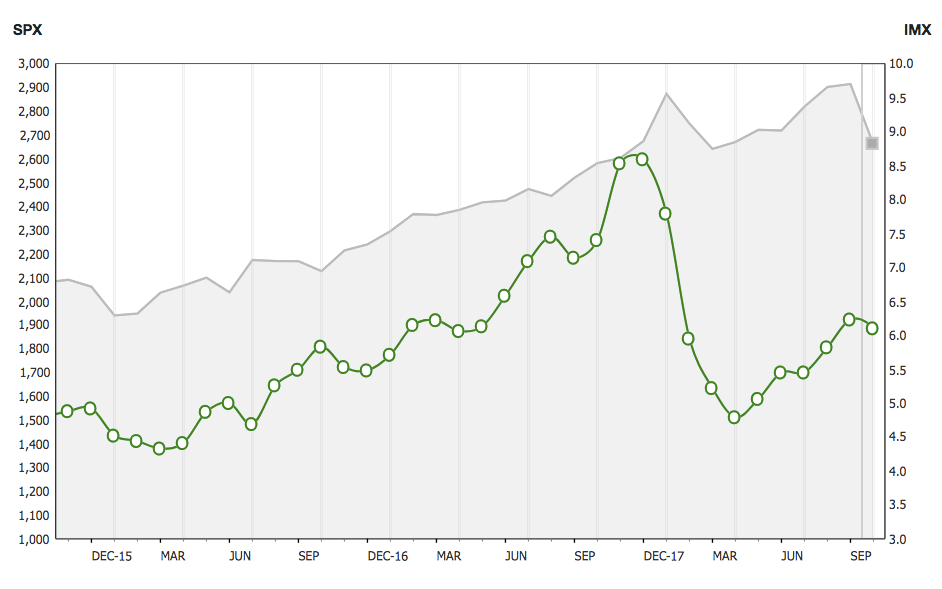
The IMX decreased for the first time in six months, moving lower by 2.09 percent in October to 6.10, from 6.23 the previous period.
TD Ameritrade clients were once again net buyers during the October period, finding value in the market as overall volatility increased and indices moved lower. The reduction in IMX score was caused by relative volatility decreasing among widely held names, even as overall market volatility increased. Apple Inc. (NASDAQ: AAPL), Facebook, Inc. (NASDAQ: FB), and Microsoft Corporation (NASDAQ: MSFT) all saw their relative volatility decrease during the period, helping push the IMX lower. Volatility of the S&P 500, as measured by the Cboe® Volatility Index, or VIX, was up nearly 100 percent during the period.
U.S. equity markets turned lower during the October IMX period. The Nasdaq Composite had the worst returns of the three major U.S. indices, and was down 10.9 percent. The S&P 500 and Dow Jones Industrial Average were also down during the period, 8.8 and 6.7 percent, respectively. Overall market volatility increased as investors focused on climbing bond yields, slowing global growth, and increasing trade tensions. The Fed minutes of the September meeting were released, which noted Fed officials see a strong economy and would continue to increase interest rates. Economic growth in China slowed to 6.5 percent, the slowest pace since the financial crisis. Despite slowing growth in China, the U.S. reported GDP growth of 3.5 percent.
Trading
TD Ameritrade clients found some names to buy during the market downturn in October. Microsoft overtook Amazon.com, Inc. (NASDAQ: AMZN) to become the second most valuable company by market cap in the world during the period, and both stocks were net bought by TD Ameritrade clients. MSFT reported a 28 percent increase in server products and cloud-services revenue last quarter and beat on earnings. AMZN announced it was raising its minimum wage to $15/hour, but the stock traded lower during the period and is down roughly 20 percent since highs in September. Ford Motor Company (NYSE: F) has traded lower recently following tariff and interest rate concerns, but posted better-than-expected revenue during the period and was net bought. Apple was a net buy as the iPhone XR went on sale during the period, the cheapest of its three new iPhone models. AT&T Inc. (NYSE: T) completed the first successful test of a 5G hotspot using a commercial-grade device, which they plan to release later this year, and was net bought.
Additional popular names bought include Tesla Inc. (NASDAQ: TSLA) and New Age Beverages Corp. (NASDAQ: NBEV).
TD Ameritrade clients sold chip makers Qualcomm Inc. (NASDAQ: QCOM) and Advanced Micro Devices, Inc. (NASDAQ: AMD), each of which is down double-digits during the period. Global sales of semiconductors continue to march toward record highs, but growth has slowed resulting in lower share prices. Twitter Inc. (NYSE: TWTR) moved higher after beating on revenue and earnings, although user numbers slipped, and was net sold. Gilead Sciences, Inc. (NASDAQ: GILD) beat on earnings and boosted revenue guidance and was net sold. Starbucks Corporation (NASDAQ: SBUX), which was up roughly 20 percent from June lows as it executes a $5 billion share buyback, was also net sold.
Additional names sold include Facebook and Exxon Mobil Corporation (NYSE: XOM).
Inclusion of specific security names in this commentary does not constitute a recommendation from TD Ameritrade to buy, sell, or hold.
Historical Overview
TD Ameritrade's Investor Movement Index (IMX) has generally correlated with the S&P 500 as clients react to equity price movements, but the index has gone through uncorrelated periods. Beginning in January 2010, when TD Ameritrade started tracking the IMX, the index rose with equity markets until April 2010, when it peaked at 5.40. In May 2010 investors experienced the "Flash Crash" and the IMX began a sharp downward trend. The IMX didn't reach 5.00 again until the S&P 500 was well above April 2010 levels. The index eventually peaked at 5.56 in June 2011. This peak was immediately followed by a plunge in equity markets, and in the IMX, as the media was dominated by the U.S. debt ceiling debate, S&P downgrade of U.S. debt, and European debt concerns. The S&P 500 began to recover in the fall of 2011, but the IMX continued to decline until it reached a new low at the time in January 2012. As the S&P 500 began to sustain an upward trend in early 2012, the IMX started to rise. In 2013, as economic conditions improved and the S&P 500 climbed to record levels, the IMX rose to the high end of its historical range, finishing 2013 at 5.62, and continued to rise in 2014 amid geopolitical tensions related to Ukraine and the Middle East, until seeing slight declines in October and November. By the middle of 2015 the IMX had seen increases, as equity market volatility had reduced to near historical levels while the market continued its upward trend. As 2015 ended its third quarter, volatility had returned to markets, as global economic concerns and speculation around the timing and trajectory of Federal Reserve rate increases seemed to rattle overall equity markets. This uncertainty continued to play a role in the equity markets through the fourth quarter of 2015 and into early 2016. The volatility accompanying this uncertainty abated in the second quarter of 2016 and remained low until late in the third quarter. Just as it had in 2015, the IMX saw increases mid-year during the period of lower volatility. The IMX continued to climb into the fourth quarter reaching 5.83 in October 2016, its highest point in two years. A brief spike in volatility during November, timed around the U.S. presidential election, coincided with a slight pull back in the IMX, which then ended 2016 at the high end of its historical range. The IMX started 2017 with an upward trend and reaching an all-time high in March, before pausing in April as lower volatility lead to a decrease in the IMX. The momentum resumed in May, with the IMX breaching 7.0 for the first time ever in July of 2017. The IMX took another brief pause in September, before following markets higher and breaching 8.0 for the first time ever in November and ending 2017 at an all-time high. Volatility returned to the markets in early 2018, and the IMX decreased for four consecutive months to start the year. The IMX then rebounded in the spring of 2018 and continued higher during the summer on the back of better-than-expected earnings and increasing equity markets.
Information from TDA is not intended to be investment advice or construed as a recommendation or endorsement of any particular investment or investment strategy, and is for illustrative purposes only. Be sure to understand all risks involved with each strategy, including commission costs, before attempting to place any trade.
See more from Benzinga
© 2018 Benzinga.com. Benzinga does not provide investment advice. All rights reserved.
