Investors Who Bought Fletcher Building (NZSE:FBU) Shares Five Years Ago Are Now Down 49%

Want to participate in a research study? Help shape the future of investing tools and earn a $60 gift card!
The main aim of stock picking is to find the market-beating stocks. But even the best stock picker will only win with some selections. So we wouldn't blame long term Fletcher Building Limited (NZSE:FBU) shareholders for doubting their decision to hold, with the stock down 49% over a half decade. The good news is that the stock is up 1.3% in the last week.
See our latest analysis for Fletcher Building
While markets are a powerful pricing mechanism, share prices reflect investor sentiment, not just underlying business performance. By comparing earnings per share (EPS) and share price changes over time, we can get a feel for how investor attitudes to a company have morphed over time.
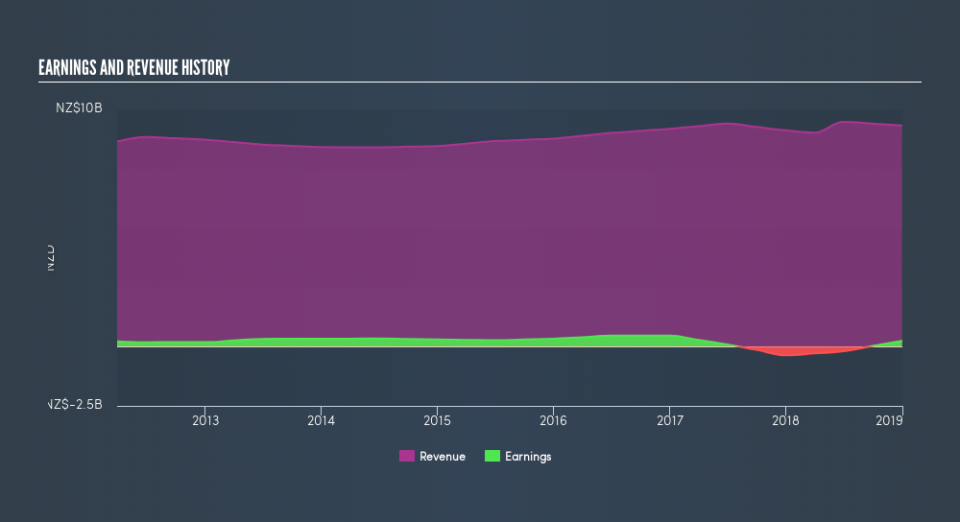
Fletcher Building became profitable within the last five years. That would generally be considered a positive, so we are surprised to see the share price is down. Other metrics may better explain the share price move.
Revenue is actually up 2.6% over the time period. A more detailed examination of the revenue and earnings may or may not explain why the share price languishes; there could be an opportunity.
The graphic below shows how revenue and earnings have changed as management guided the business forward. If you want to see cashflow, you can click on the chart.
Fletcher Building is a well known stock, with plenty of analyst coverage, suggesting some visibility into future growth. You can see what analysts are predicting for Fletcher Building in this interactive graph of future profit estimates.
What About Dividends?
It is important to consider the total shareholder return, as well as the share price return, for any given stock. The TSR incorporates the value of any spin-offs or discounted capital raisings, along with any dividends, based on the assumption that the dividends are reinvested. It's fair to say that the TSR gives a more complete picture for stocks that pay a dividend. As it happens, Fletcher Building's TSR for the last 5 years was -35%, which exceeds the share price return mentioned earlier. This is largely a result of its dividend payments!
A Different Perspective
Fletcher Building shareholders are down 18% for the year (even including dividends), but the market itself is up 11%. Even the share prices of good stocks drop sometimes, but we want to see improvements in the fundamental metrics of a business, before getting too interested. Unfortunately, last year's performance may indicate unresolved challenges, given that it was worse than the annualised loss of 8.4% over the last half decade. Generally speaking long term share price weakness can be a bad sign, though contrarian investors might want to research the stock in hope of a turnaround. Before forming an opinion on Fletcher Building you might want to consider the cold hard cash it pays as a dividend. This free chart tracks its dividend over time.
For those who like to find winning investments this free list of growing companies with recent insider purchasing, could be just the ticket.
Please note, the market returns quoted in this article reflect the market weighted average returns of stocks that currently trade on NZ exchanges.
We aim to bring you long-term focused research analysis driven by fundamental data. Note that our analysis may not factor in the latest price-sensitive company announcements or qualitative material.
If you spot an error that warrants correction, please contact the editor at editorial-team@simplywallst.com. This article by Simply Wall St is general in nature. It does not constitute a recommendation to buy or sell any stock, and does not take account of your objectives, or your financial situation. Simply Wall St has no position in the stocks mentioned. Thank you for reading.
