Investors in CRH (LON:CRH) have unfortunately lost 16% over the last year
Investors can approximate the average market return by buying an index fund. While individual stocks can be big winners, plenty more fail to generate satisfactory returns. That downside risk was realized by CRH plc (LON:CRH) shareholders over the last year, as the share price declined 18%. That falls noticeably short of the market decline of around 5.4%. On the other hand, the stock is actually up 14% over three years. The falls have accelerated recently, with the share price down 14% in the last three months. Of course, this share price action may well have been influenced by the 6.9% decline in the broader market, throughout the period.
With that in mind, it's worth seeing if the company's underlying fundamentals have been the driver of long term performance, or if there are some discrepancies.
View our latest analysis for CRH
While the efficient markets hypothesis continues to be taught by some, it has been proven that markets are over-reactive dynamic systems, and investors are not always rational. By comparing earnings per share (EPS) and share price changes over time, we can get a feel for how investor attitudes to a company have morphed over time.
During the unfortunate twelve months during which the CRH share price fell, it actually saw its earnings per share (EPS) improve by 130%. It could be that the share price was previously over-hyped.
It's fair to say that the share price does not seem to be reflecting the EPS growth. So it's well worth checking out some other metrics, too.
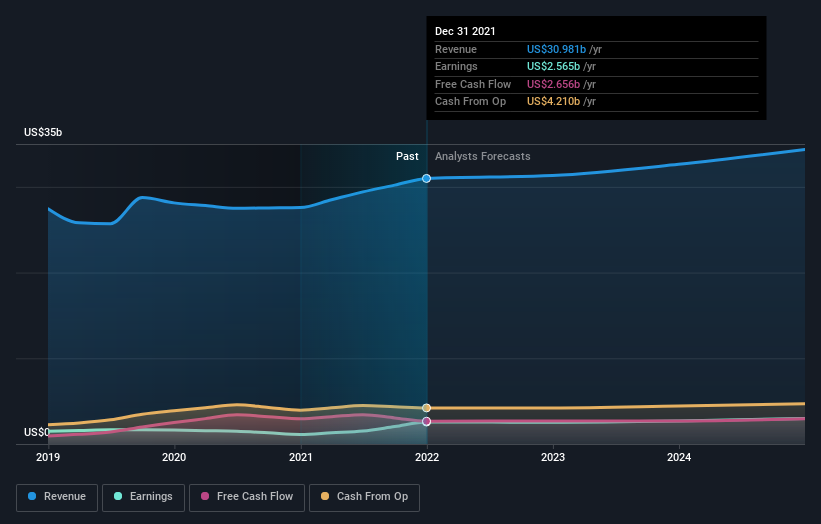
CRH's revenue is actually up 12% over the last year. Since we can't easily explain the share price movement based on these metrics, it might be worth considering how market sentiment has changed towards the stock.
You can see below how earnings and revenue have changed over time (discover the exact values by clicking on the image).
CRH is a well known stock, with plenty of analyst coverage, suggesting some visibility into future growth. So we recommend checking out this free report showing consensus forecasts
What About Dividends?
It is important to consider the total shareholder return, as well as the share price return, for any given stock. Whereas the share price return only reflects the change in the share price, the TSR includes the value of dividends (assuming they were reinvested) and the benefit of any discounted capital raising or spin-off. So for companies that pay a generous dividend, the TSR is often a lot higher than the share price return. We note that for CRH the TSR over the last 1 year was -16%, which is better than the share price return mentioned above. And there's no prize for guessing that the dividend payments largely explain the divergence!
A Different Perspective
We regret to report that CRH shareholders are down 16% for the year (even including dividends). Unfortunately, that's worse than the broader market decline of 5.4%. Having said that, it's inevitable that some stocks will be oversold in a falling market. The key is to keep your eyes on the fundamental developments. On the bright side, long term shareholders have made money, with a gain of 3% per year over half a decade. It could be that the recent sell-off is an opportunity, so it may be worth checking the fundamental data for signs of a long term growth trend. Importantly, we haven't analysed CRH's dividend history. This free visual report on its dividends is a must-read if you're thinking of buying.
If you would prefer to check out another company -- one with potentially superior financials -- then do not miss this free list of companies that have proven they can grow earnings.
Please note, the market returns quoted in this article reflect the market weighted average returns of stocks that currently trade on GB exchanges.
Have feedback on this article? Concerned about the content? Get in touch with us directly. Alternatively, email editorial-team (at) simplywallst.com.
This article by Simply Wall St is general in nature. We provide commentary based on historical data and analyst forecasts only using an unbiased methodology and our articles are not intended to be financial advice. It does not constitute a recommendation to buy or sell any stock, and does not take account of your objectives, or your financial situation. We aim to bring you long-term focused analysis driven by fundamental data. Note that our analysis may not factor in the latest price-sensitive company announcements or qualitative material. Simply Wall St has no position in any stocks mentioned.
