Investors in Finbar Group (ASX:FRI) have unfortunately lost 17% over the last year
It's easy to match the overall market return by buying an index fund. But if you buy individual stocks, you can do both better or worse than that. For example, the Finbar Group Limited (ASX:FRI) share price is down 21% in the last year. That falls noticeably short of the market decline of around 1.5%. Taking the longer term view, the stock fell 19% over the last three years. Furthermore, it's down 11% in about a quarter. That's not much fun for holders. However, one could argue that the price has been influenced by the general market, which is down 4.5% in the same timeframe.
Since shareholders are down over the longer term, lets look at the underlying fundamentals over the that time and see if they've been consistent with returns.
See our latest analysis for Finbar Group
To quote Buffett, 'Ships will sail around the world but the Flat Earth Society will flourish. There will continue to be wide discrepancies between price and value in the marketplace...' By comparing earnings per share (EPS) and share price changes over time, we can get a feel for how investor attitudes to a company have morphed over time.
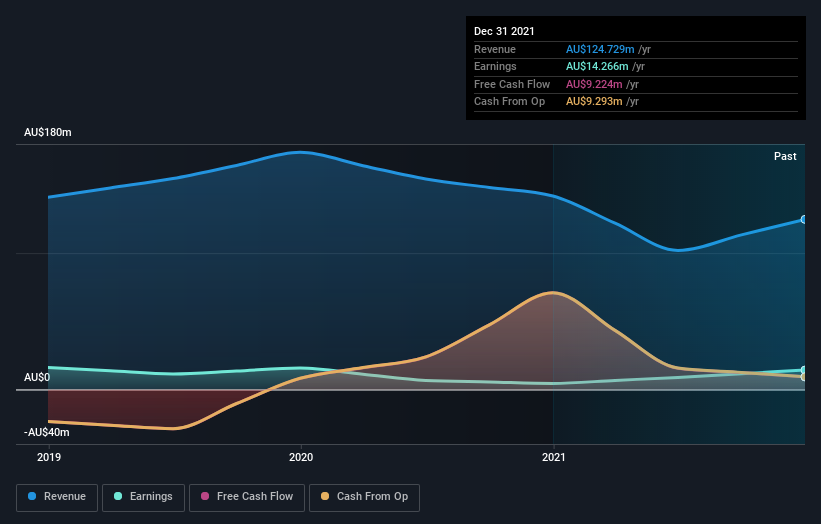
During the unfortunate twelve months during which the Finbar Group share price fell, it actually saw its earnings per share (EPS) improve by 230%. It could be that the share price was previously over-hyped.
It's surprising to see the share price fall so much, despite the improved EPS. But we might find some different metrics explain the share price movements better.
Finbar Group's dividend seems healthy to us, so we doubt that the yield is a concern for the market. In fact, it seems more likely that the revenue fall of 12% in the last year is the worry. The market may be extrapolating the decline, leading to questions around the sustainability of the EPS.
The image below shows how earnings and revenue have tracked over time (if you click on the image you can see greater detail).
We like that insiders have been buying shares in the last twelve months. Even so, future earnings will be far more important to whether current shareholders make money. Dive deeper into the earnings by checking this interactive graph of Finbar Group's earnings, revenue and cash flow.
What About Dividends?
As well as measuring the share price return, investors should also consider the total shareholder return (TSR). The TSR is a return calculation that accounts for the value of cash dividends (assuming that any dividend received was reinvested) and the calculated value of any discounted capital raisings and spin-offs. So for companies that pay a generous dividend, the TSR is often a lot higher than the share price return. In the case of Finbar Group, it has a TSR of -17% for the last 1 year. That exceeds its share price return that we previously mentioned. And there's no prize for guessing that the dividend payments largely explain the divergence!
A Different Perspective
While the broader market lost about 1.5% in the twelve months, Finbar Group shareholders did even worse, losing 17% (even including dividends). However, it could simply be that the share price has been impacted by broader market jitters. It might be worth keeping an eye on the fundamentals, in case there's a good opportunity. Longer term investors wouldn't be so upset, since they would have made 3%, each year, over five years. It could be that the recent sell-off is an opportunity, so it may be worth checking the fundamental data for signs of a long term growth trend. It's always interesting to track share price performance over the longer term. But to understand Finbar Group better, we need to consider many other factors. Even so, be aware that Finbar Group is showing 2 warning signs in our investment analysis , you should know about...
Finbar Group is not the only stock that insiders are buying. For those who like to find winning investments this free list of growing companies with recent insider purchasing, could be just the ticket.
Please note, the market returns quoted in this article reflect the market weighted average returns of stocks that currently trade on AU exchanges.
Have feedback on this article? Concerned about the content? Get in touch with us directly. Alternatively, email editorial-team (at) simplywallst.com.
This article by Simply Wall St is general in nature. We provide commentary based on historical data and analyst forecasts only using an unbiased methodology and our articles are not intended to be financial advice. It does not constitute a recommendation to buy or sell any stock, and does not take account of your objectives, or your financial situation. We aim to bring you long-term focused analysis driven by fundamental data. Note that our analysis may not factor in the latest price-sensitive company announcements or qualitative material. Simply Wall St has no position in any stocks mentioned.
