What Investors Should Know About Douglas Dynamics, Inc.'s (NYSE:PLOW) Financial Strength

Investors are always looking for growth in small-cap stocks like Douglas Dynamics, Inc. (NYSE:PLOW), with a market cap of US$884m. However, an important fact which most ignore is: how financially healthy is the business? Evaluating financial health as part of your investment thesis is crucial, since poor capital management may bring about bankruptcies, which occur at a higher rate for small-caps. The following basic checks can help you get a picture of the company's balance sheet strength. Nevertheless, this is not a comprehensive overview, so I recommend you dig deeper yourself into PLOW here.
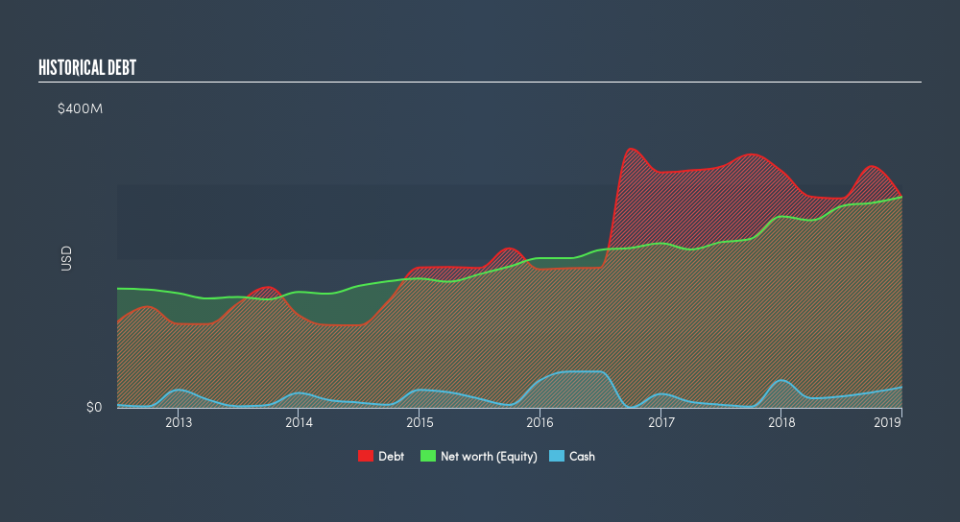
Does PLOW Produce Much Cash Relative To Its Debt?
PLOW has shrunk its total debt levels in the last twelve months, from US$318m to US$282m , which also accounts for long term debt. With this debt repayment, PLOW's cash and short-term investments stands at US$28m , ready to be used for running the business. Additionally, PLOW has generated cash from operations of US$58m during the same period of time, leading to an operating cash to total debt ratio of 21%, signalling that PLOW’s current level of operating cash is high enough to cover debt.
Does PLOW’s liquid assets cover its short-term commitments?
Looking at PLOW’s US$79m in current liabilities, it appears that the company has been able to meet these commitments with a current assets level of US$199m, leading to a 2.52x current account ratio. The current ratio is the number you get when you divide current assets by current liabilities. For Machinery companies, this ratio is within a sensible range since there is a bit of a cash buffer without leaving too much capital in a low-return environment.
Does PLOW face the risk of succumbing to its debt-load?
PLOW is a relatively highly levered company with a debt-to-equity of 100%. This is a bit unusual for a small-cap stock, since they generally have a harder time borrowing than large more established companies. No matter how high the company’s debt, if it can easily cover the interest payments, it’s considered to be efficient with its use of excess leverage. A company generating earnings before interest and tax (EBIT) at least three times its net interest payments is considered financially sound. In PLOW's case, the ratio of 4.28x suggests that interest is appropriately covered, which means that lenders may be willing to lend out more funding as PLOW’s high interest coverage is seen as responsible and safe practice.
Next Steps:
Although PLOW’s debt level is towards the higher end of the spectrum, its cash flow coverage seems adequate to meet obligations which means its debt is being efficiently utilised. This may mean this is an optimal capital structure for the business, given that it is also meeting its short-term commitment. I admit this is a fairly basic analysis for PLOW's financial health. Other important fundamentals need to be considered alongside. I suggest you continue to research Douglas Dynamics to get a better picture of the small-cap by looking at:
Future Outlook: What are well-informed industry analysts predicting for PLOW’s future growth? Take a look at our free research report of analyst consensus for PLOW’s outlook.
Valuation: What is PLOW worth today? Is the stock undervalued, even when its growth outlook is factored into its intrinsic value? The intrinsic value infographic in our free research report helps visualize whether PLOW is currently mispriced by the market.
Other High-Performing Stocks: Are there other stocks that provide better prospects with proven track records? Explore our free list of these great stocks here.
We aim to bring you long-term focused research analysis driven by fundamental data. Note that our analysis may not factor in the latest price-sensitive company announcements or qualitative material.
If you spot an error that warrants correction, please contact the editor at editorial-team@simplywallst.com. This article by Simply Wall St is general in nature. It does not constitute a recommendation to buy or sell any stock, and does not take account of your objectives, or your financial situation. Simply Wall St has no position in the stocks mentioned. Thank you for reading.
