What Investors Should Know About Genpact Limited’s (G) Financial Strength

Small-caps and large-caps are wildly popular among investors; however, mid-cap stocks, such as Genpact Limited (NYSE:G) with a market-capitalization of USD $6.18B, rarely draw their attention and few analysts cover them. However, generally ignored mid-caps have historically delivered better risk adjusted returns than both of those groups, primarily due to seasoned executives running a lean corporate structure. I recommend you look at the following hurdles to assess G’s financial health. View our latest analysis for Genpact
Does G face the risk of succumbing to its debt-load?

While ideally the debt-to equity ratio of a financially healthy company should be less than 40%, several factors such as industry life-cycle and economic conditions can result in a company raising a significant amount of debt. G’s debt-to-equity ratio stands at 92.54%, which means that it is a highly leveraged company. This is not a problem if the company has consistently grown its profits. But during a business downturn, availability of cash may dry up, making it hard to operate. While debt-to-equity ratio has several factors at play, an easier way to check whether G’s leverage is at a sustainable level is to check its ability to service the debt. A company generating earnings (EBIT) at least three times its interest payments is considered financially sound. In G’s case, its interest is excessively covered by its earnings as the ratio sits at 12.4x. This means lenders may be inclined to lend more money to the company, as it is seen as safe in terms of payback.
Does G’s liquid assets cover its short-term commitments?
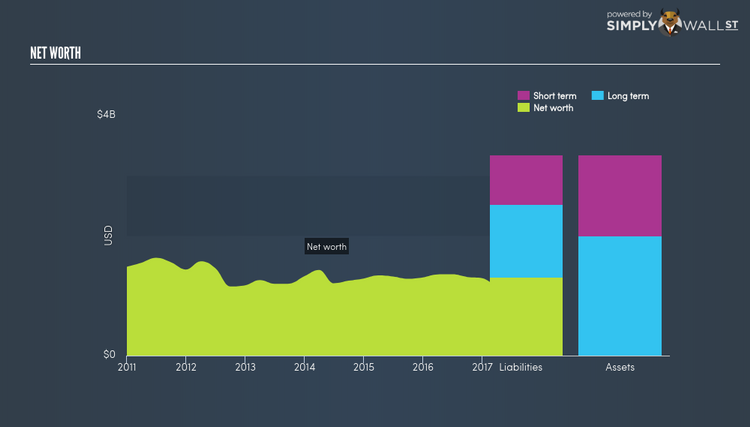
A different measure of financial health is measured by its short-term obligations, which is known as liquidity. These include payments to suppliers, employees and other stakeholders. If an adverse event occurs, the company may be forced to pay these immediate expenses with its liquid assets. To assess this, I compare G’s cash and other liquid assets against its upcoming debt. Our analysis shows that G is able to meet its upcoming commitments with its cash and other short-term assets, which lessens our concerns for the company’s business operations should any unfavourable circumstances arise.
Next Steps:
Are you a shareholder? G’s high cash coverage means that, although its debt levels are high, investors shouldn’t panic since the company is able to utilise its borrowings efficiently in order to generate cash flow. Given that G’s capital structure may change over time, I encourage assessing market expectations for G’s future growth on our free analysis platform.
Are you a potential investor? While investors should analyse the serviceability of debt, it shouldn’t be viewed in isolation of other factors. After all, debt is often used to fund or accelerate new projects that are expected to improve a company’s growth trajectory in the longer term. G’s Return on Capital Employed (ROCE) in order to see management’s track record at deploying funds in high-returning projects.
To help readers see pass the short term volatility of the financial market, we aim to bring you a long-term focused research analysis purely driven by fundamental data. Note that our analysis does not factor in the latest price sensitive company announcements.
The author is an independent contributor and at the time of publication had no position in the stocks mentioned.
