Can IRB Infrastructure Developers Limited’s (NSE:IRB) ROE Continue To Surpass The Industry Average?

This analysis is intended to introduce important early concepts to people who are starting to invest and looking to gauge the potential return on investment in IRB Infrastructure Developers Limited (NSE:IRB).
IRB Infrastructure Developers Limited (NSE:IRB) delivered an ROE of 16.16% over the past 12 months, which is an impressive feat relative to its industry average of 8.44% during the same period. On the surface, this looks fantastic since we know that IRB has made large profits from little equity capital; however, ROE doesn’t tell us if management have borrowed heavily to make this happen. In this article, we’ll closely examine some factors like financial leverage to evaluate the sustainability of IRB’s ROE. See our latest analysis for IRB Infrastructure Developers
Breaking down ROE — the mother of all ratios
Firstly, Return on Equity, or ROE, is simply the percentage of last years’ earning against the book value of shareholders’ equity. An ROE of 16.16% implies ₹0.16 returned on every ₹1 invested. While a higher ROE is preferred in most cases, there are several other factors we should consider before drawing any conclusions.
Return on Equity = Net Profit ÷ Shareholders Equity
ROE is measured against cost of equity in order to determine the efficiency of IRB Infrastructure Developers’s equity capital deployed. Its cost of equity is 18.66%. Since IRB Infrastructure Developers’s return does not cover its cost, with a difference of -2.50%, this means its current use of equity is not efficient and not sustainable. Very simply, IRB Infrastructure Developers pays more for its capital than what it generates in return. ROE can be split up into three useful ratios: net profit margin, asset turnover, and financial leverage. This is called the Dupont Formula:
Dupont Formula
ROE = profit margin × asset turnover × financial leverage
ROE = (annual net profit ÷ sales) × (sales ÷ assets) × (assets ÷ shareholders’ equity)
ROE = annual net profit ÷ shareholders’ equity

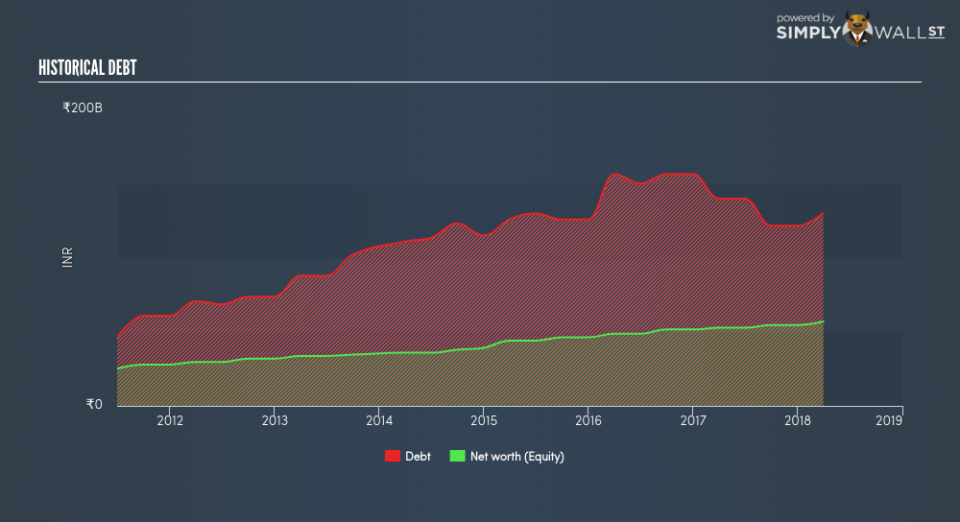
Basically, profit margin measures how much of revenue trickles down into earnings which illustrates how efficient the business is with its cost management. The other component, asset turnover, illustrates how much revenue IRB Infrastructure Developers can make from its asset base. Finally, financial leverage will be our main focus today. It shows how much of assets are funded by equity and can show how sustainable the company’s capital structure is. Since ROE can be artificially increased through excessive borrowing, we should check IRB Infrastructure Developers’s historic debt-to-equity ratio. Currently the debt-to-equity ratio stands at a high 228.30%, which means its above-average ROE is driven by significant debt levels.
Next Steps:
ROE is one of many ratios which meaningfully dissects financial statements, which illustrates the quality of a company. IRB Infrastructure Developers exhibits a strong ROE against its peers, however it was not high enough to cover its own cost of equity this year. With debt capital in excess of equity, ROE may be inflated by the use of debt funding, raising questions over the sustainability of the company’s returns. Although ROE can be a useful metric, it is only a small part of diligent research.
For IRB Infrastructure Developers, there are three important factors you should look at:
Financial Health: Does it have a healthy balance sheet? Take a look at our free balance sheet analysis with six simple checks on key factors like leverage and risk.
Valuation: What is IRB Infrastructure Developers worth today? Is the stock undervalued, even when its growth outlook is factored into its intrinsic value? The intrinsic value infographic in our free research report helps visualize whether IRB Infrastructure Developers is currently mispriced by the market.
Other High-Growth Alternatives : Are there other high-growth stocks you could be holding instead of IRB Infrastructure Developers? Explore our interactive list of stocks with large growth potential to get an idea of what else is out there you may be missing!
To help readers see pass the short term volatility of the financial market, we aim to bring you a long-term focused research analysis purely driven by fundamental data. Note that our analysis does not factor in the latest price sensitive company announcements.
The author is an independent contributor and at the time of publication had no position in the stocks mentioned.
