ITT Inc (NYSE:ITT): The Yield That Matters The Most

ITT Inc (NYSE:ITT) shareholders, and potential investors, need to understand how much cash the business makes from its core operational activities, as well as how much is invested back into the business. What is left after investment, determines the value of the stock since this cash flow technically belongs to investors of the company. I will take you through ITT’s cash flow health and the risk-return concept based on the stock’s cash flow yield, using the most recent financial data. This will help you think about the company from a cash perspective, which is a crucial factor to investing.
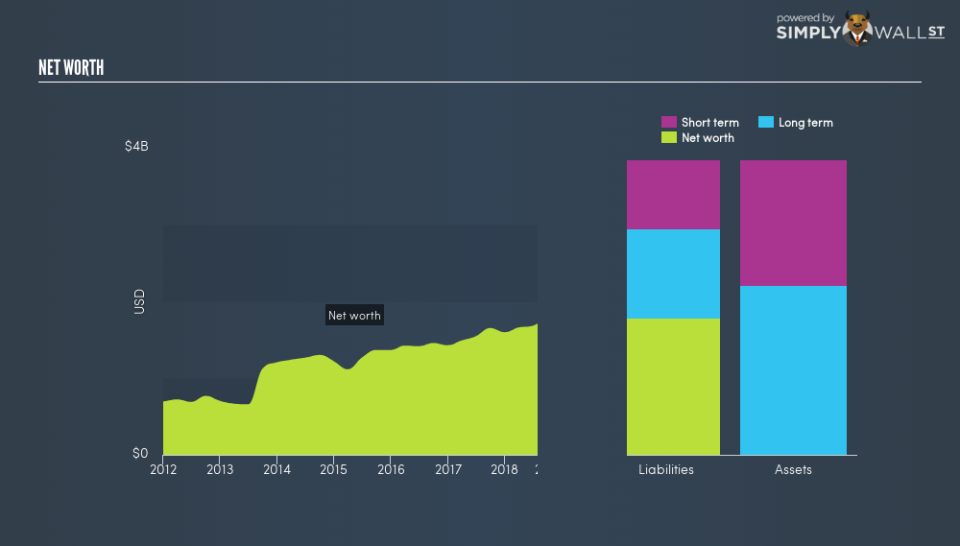
See our latest analysis for ITT
What is free cash flow?
ITT generates cash through its day-to-day business, which needs to be reinvested into the company in order for it to continue operating. What remains after this expenditure, is known as its free cash flow, or FCF, for short.
There are two methods I will use to evaluate the quality of ITT’s FCF: firstly, I will measure its FCF yield relative to the market index yield; secondly, I will examine whether its operating cash flow will continue to grow into the future, which will give us a sense of sustainability.
Free Cash Flow = Operating Cash Flows – Net Capital Expenditure
Free Cash Flow Yield = Free Cash Flow / Enterprise Value
where Enterprise Value = Market Capitalisation + Net Debt
ITT’s yield of 5.72% last year indicates its ability to produce cash at the same rate as the market index, taking into account the company’s size. However, given that the risk for holding single-stock ITT is higher, this may mean inadequate compensation above and beyond merely investing in the whole market.
Is ITT’s yield sustainable?
Can ITT improve its operating cash production in the future? Let’s take a quick look at the cash flow trend the company is expected to deliver over time. Over the next couple years, the company is expected to grow its cash from operations at a double-digit rate of 42%, ramping up from its current levels of US$313m to US$445m in three years’ time. Although this seems impressive, breaking down into year-on-year growth rates, ITT’s operating cash flow growth is expected to decline from a rate of 23% in the upcoming year, to 7.9% by the end of the third year. But the overall future outlook seems buoyant if ITT can maintain its levels of capital expenditure as well.
Next Steps:
ITT is compensating investors at a cash yield similar to the wider market portfolio. But holding the stock on its own is riskier than investing in the diversified market, which means the yield is not that attractive on a risk-return basis. Now you know to keep cash flows in mind, I recommend you continue to research ITT to get a better picture of the company by looking at:
Valuation: What is ITT worth today? Is the stock undervalued, even when its growth outlook is factored into its intrinsic value? The intrinsic value infographic in our free research report helps visualize whether ITT is currently mispriced by the market.
Management Team: An experienced management team on the helm increases our confidence in the business – take a look at who sits on ITT’s board and the CEO’s back ground.
Other High-Performing Stocks: If you believe you should cushion your portfolio with something less risky, scroll through our free list of these great stocks here.
To help readers see past the short term volatility of the financial market, we aim to bring you a long-term focused research analysis purely driven by fundamental data. Note that our analysis does not factor in the latest price-sensitive company announcements.
The author is an independent contributor and at the time of publication had no position in the stocks mentioned. For errors that warrant correction please contact the editor at editorial-team@simplywallst.com.
