ITT Q1 Earnings & Revenues Beat Estimates, 2023 EPS View Up
ITT Inc.’s ITT first-quarter 2023 adjusted earnings (excluding 3 cents from non-recurring items) of $1.17 per share surpassed the Zacks Consensus Estimate of $1.10. Our estimate for first-quarter adjusted earnings also stood at $1.10. The bottom line jumped 21% year over year, owing to higher revenues.
Total revenues of $797.9 million beat the Zacks Consensus Estimate of $773.1 million. This compares with our estimate of $777.6 million. The top line increased 9.9% year over year, owing to strong demand in Industrial Process (IP) short-cycle business and aerospace market within the Connect and Control Technologies (CCT) segment, robust pump project activity and pricing actions across all segments. The acquisition of Habonim contributed 2% to the top line. Organic sales rose 10.3% year over year.
In the reported quarter, total orders climbed 7% year over year, thanks to strong demand in IP’s short-cycle business and CCT’s aerospace market and robust pump project activity.
ITT Inc. Price, Consensus and EPS Surprise
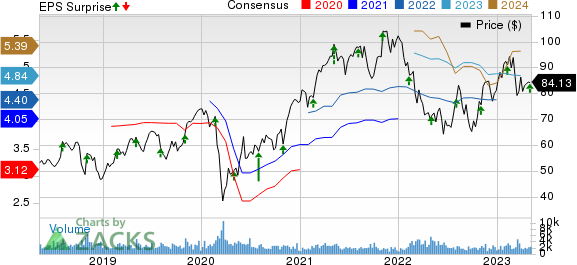
ITT Inc. price-consensus-eps-surprise-chart | ITT Inc. Quote
Segmental Results
Revenues from IP totaled $266.5 million, up 31.8% year over year. Our estimate for Industrial Process revenues was $253.7 million.
Short-cycle demand, growth in pump projects and benefits from the acquisition of Habonim drove the segment’s performance. Organic sales increased 25.5%. The adjusted operating income augmented more than 100% year over year.
Revenues from Motion Technologies totaled $364.8 million, reflecting a year-over-year decrease of 1.4%. Our estimate for segmental revenues in the quarter was $362 million.
The impact of unfavorable foreign currency translation of $14 million and the effects of the Russia-Ukraine war weighed on the segment’s performance. Organic revenues inched 2.2% owing to growth in friction and rail. The adjusted operating income decreased 26.7% year over year.
Revenues from CCT totaled $167.6 million, up 8.4% year over year and up 9.8% organically. Our estimate for segmental revenues was $162.6 million.
Growth in aerospace and defense markets aided the segment’s performance. The adjusted operating income increased 13.6% year over year owing to productivity improvement, higher volumes and pricing actions.
Margin Profile
During the first quarter, ITT’s cost of revenues increased 5.6% year over year to $536 million. The gross profit increased 19.9% to $261.9 million.
General and administrative expenses decreased 13.1% year over year to $68.3 million, while sales and marketing expenses rose 11.7% to $42.9 million. Research and development expenses inched up 5.6% year over year to $26.4 million.
The adjusted segmental operating income in the quarter increased 20.3% year over year to $140 million. The margin increased 150 basis points (bps) to 17.5%. Results benefited from higher sales volume and pricing actions.
Balance Sheet and Cash Flow
Exiting the first quarter, ITT had cash and cash equivalents of $462 million compared with $561.2 million at the end of fourth-quarter 2022. The company’s commercial paper and current maturities of long-term debt were $384.1 million compared with $451 million at the end of December 2022.
In the first quarter, ITT generated net cash of $58.1 million from operating activities against $2.7 million used in the year-ago period. During the first quarter, capital expenditure totaled $28.7 million, down 2.4% year over year. Free cash flow was $29.4 million in the first quarter against free cash outflow of $32.7 million at the end of the year-ago period.
During the first quarter, ITT paid out dividends of $24.2 million, up 8% year over year. Share repurchases were $30 million in the period compared with $163.9 million in the year-ago period.
2023 Outlook
ITT expects adjusted earnings of $4.65-$4.95 per share compared with $4.55-$4.95 anticipated earlier. The guided range reflects a 5-11% increase year over year. The mid-point of the guided range — $4.80 — lies below the Zacks Consensus Estimate of $4.84.
ITT continues to expect a 7-9% (6-8% organically) increase in revenues in 2023. Adjusted segment operating margin is estimated to be 17.3-18.1%, indicating an increase of 10-90 bps. Free cash flow is estimated to be $350-$400 million in 2023. This indicates a free cash flow margin of 11-12%.
Zacks Rank & Key Picks
ITT carries a Zacks Rank #3 (Hold).
Some better-ranked stocks within the broader Industrial Products sector are as follows:
Ingersoll Rand IR presently carries a Zacks Rank #2 (Buy). The company pulled off a trailing four-quarter earnings surprise of 12.6%, on average. You can see the complete list of today’s Zacks #1 Rank (Strong Buy) stocks.
Ingersoll Rand has an estimated earnings growth rate of 7.6% for the current year. The stock has rallied 13.2% in the year-to-date period.
Allegion ALLE presently carries a Zacks Rank #2. The company delivered a trailing four-quarter earnings surprise of 12.5%, on average.
Allegion has an estimated earnings growth rate of 15.1% for the current year. The stock has gained approximately 3% in the year-to-date period.
Want the latest recommendations from Zacks Investment Research? Today, you can download 7 Best Stocks for the Next 30 Days. Click to get this free report
ITT Inc. (ITT) : Free Stock Analysis Report
Ingersoll Rand Inc. (IR) : Free Stock Analysis Report
Allegion PLC (ALLE) : Free Stock Analysis Report
