Johnson Service Group PLC (LON:JSG): Has Recent Earnings Growth Beaten Long-Term Trend?

Understanding how Johnson Service Group PLC (LON:JSG) is performing as a company requires looking at more than just a years’ earnings. Today I will run you through a basic sense check to gain perspective on how Johnson Service Group is doing by comparing its latest earnings with its long-term trend as well as the performance of its commercial services industry peers. Check out our latest analysis for Johnson Service Group
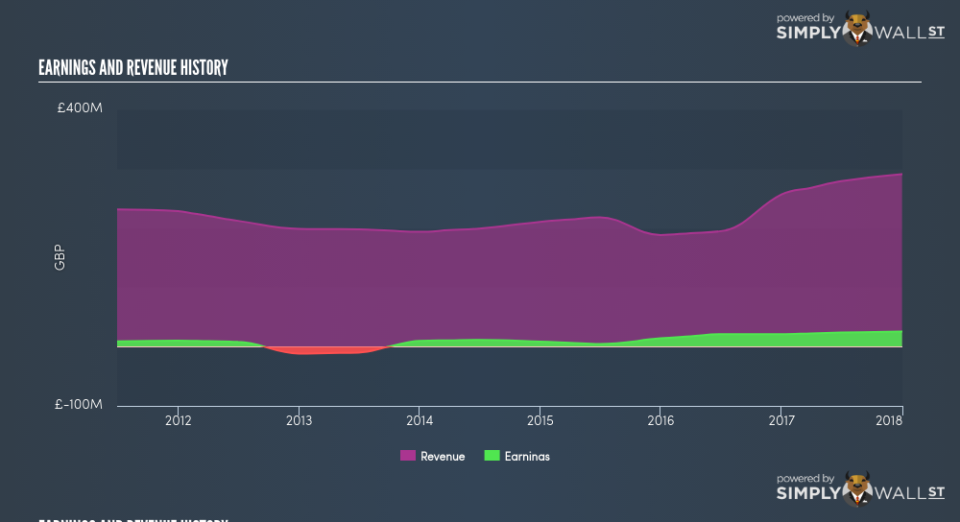
How Well Did JSG Perform?
JSG’s trailing twelve-month earnings (from 31 December 2017) of UK£25.40m has jumped 21.53% compared to the previous year. However, this one-year growth rate has been lower than its average earnings growth rate over the past 5 years of 30.08%, indicating the rate at which JSG is growing has slowed down. Why could this be happening? Well, let’s look at what’s occurring with margins and whether the whole industry is experiencing the hit as well.
In the past few years, revenue growth has failed to keep up which indicates that Johnson Service Group’s bottom line has been propelled by unsustainable cost-reductions. Looking at growth from a sector-level, the UK commercial services industry has been growing its average earnings by double-digit 12.78% in the past twelve months, and 15.09% over the last five years. This shows that any uplift the industry is gaining from, Johnson Service Group is able to leverage this to its advantage.
In terms of returns from investment, Johnson Service Group has not invested its equity funds well, leading to a 15.16% return on equity (ROE), below the sensible minimum of 20%. However, its return on assets (ROA) of 7.90% exceeds the GB Commercial Services industry of 5.82%, indicating Johnson Service Group has used its assets more efficiently. Though, its return on capital (ROC), which also accounts for Johnson Service Group’s debt level, has declined over the past 3 years from 13.71% to 11.49%.
What does this mean?
Though Johnson Service Group’s past data is helpful, it is only one aspect of my investment thesis. Companies that have performed well in the past, such as Johnson Service Group gives investors conviction. However, the next step would be to assess whether the future looks as optimistic. I recommend you continue to research Johnson Service Group to get a more holistic view of the stock by looking at:
Future Outlook: What are well-informed industry analysts predicting for JSG’s future growth? Take a look at our free research report of analyst consensus for JSG’s outlook.
Financial Health: Is JSG’s operations financially sustainable? Balance sheets can be hard to analyze, which is why we’ve done it for you. Check out our financial health checks here.
Other High-Performing Stocks: Are there other stocks that provide better prospects with proven track records? Explore our free list of these great stocks here.
NB: Figures in this article are calculated using data from the trailing twelve months from 31 December 2017. This may not be consistent with full year annual report figures.
To help readers see pass the short term volatility of the financial market, we aim to bring you a long-term focused research analysis purely driven by fundamental data. Note that our analysis does not factor in the latest price sensitive company announcements.
The author is an independent contributor and at the time of publication had no position in the stocks mentioned.
