Do You Like Johnson Matthey Plc (LON:JMAT) At This P/E Ratio?

This article is for investors who would like to improve their understanding of price to earnings ratios (P/E ratios). We'll look at Johnson Matthey Plc's (LON:JMAT) P/E ratio and reflect on what it tells us about the company's share price. What is Johnson Matthey's P/E ratio? Well, based on the last twelve months it is 13.79. That corresponds to an earnings yield of approximately 7.3%.
View our latest analysis for Johnson Matthey
How Do I Calculate A Price To Earnings Ratio?
The formula for price to earnings is:
Price to Earnings Ratio = Price per Share ÷ Earnings per Share (EPS)
Or for Johnson Matthey:
P/E of 13.79 = GBP27.61 ÷ GBP2.00 (Based on the year to September 2019.)
Is A High Price-to-Earnings Ratio Good?
A higher P/E ratio implies that investors pay a higher price for the earning power of the business. That is not a good or a bad thing per se, but a high P/E does imply buyers are optimistic about the future.
Does Johnson Matthey Have A Relatively High Or Low P/E For Its Industry?
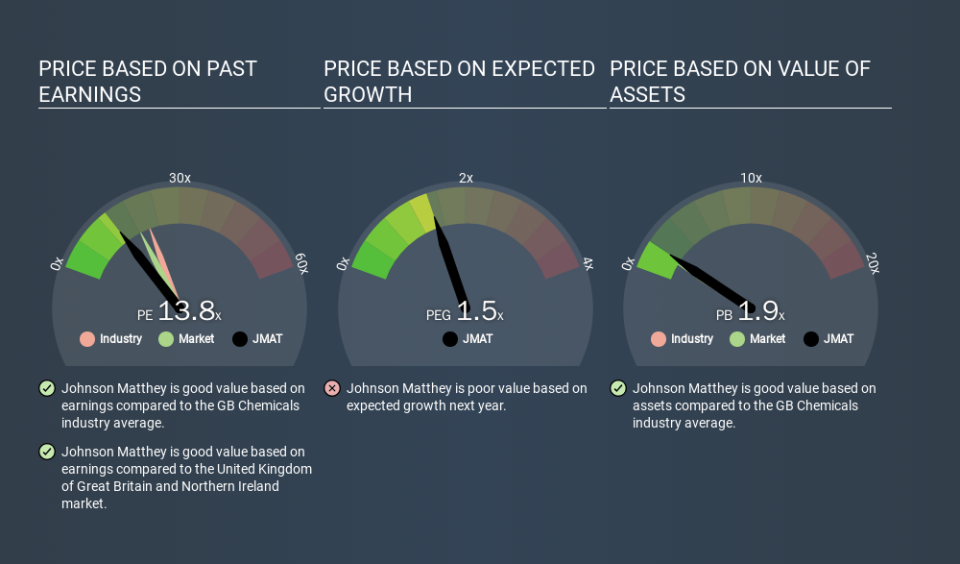
We can get an indication of market expectations by looking at the P/E ratio. The image below shows that Johnson Matthey has a lower P/E than the average (22.0) P/E for companies in the chemicals industry.
Johnson Matthey's P/E tells us that market participants think it will not fare as well as its peers in the same industry. Many investors like to buy stocks when the market is pessimistic about their prospects. You should delve deeper. I like to check if company insiders have been buying or selling.
How Growth Rates Impact P/E Ratios
Probably the most important factor in determining what P/E a company trades on is the earnings growth. Earnings growth means that in the future the 'E' will be higher. That means unless the share price increases, the P/E will reduce in a few years. A lower P/E should indicate the stock is cheap relative to others -- and that may attract buyers.
Johnson Matthey increased earnings per share by an impressive 16% over the last twelve months. And it has bolstered its earnings per share by 2.5% per year over the last five years. This could arguably justify a relatively high P/E ratio.
Don't Forget: The P/E Does Not Account For Debt or Bank Deposits
It's important to note that the P/E ratio considers the market capitalization, not the enterprise value. Thus, the metric does not reflect cash or debt held by the company. The exact same company would hypothetically deserve a higher P/E ratio if it had a strong balance sheet, than if it had a weak one with lots of debt, because a cashed up company can spend on growth.
Such spending might be good or bad, overall, but the key point here is that you need to look at debt to understand the P/E ratio in context.
Johnson Matthey's Balance Sheet
Net debt is 27% of Johnson Matthey's market cap. You'd want to be aware of this fact, but it doesn't bother us.
The Bottom Line On Johnson Matthey's P/E Ratio
Johnson Matthey's P/E is 13.8 which is below average (18.3) in the GB market. The company does have a little debt, and EPS growth was good last year. If it continues to grow, then the current low P/E may prove to be unjustified. Because analysts are predicting more growth in the future, one might have expected to see a higher P/E ratio. You can take a closer look at the fundamentals, here.
When the market is wrong about a stock, it gives savvy investors an opportunity. If it is underestimating a company, investors can make money by buying and holding the shares until the market corrects itself. So this free report on the analyst consensus forecasts could help you make a master move on this stock.
Of course you might be able to find a better stock than Johnson Matthey. So you may wish to see this free collection of other companies that have grown earnings strongly.
If you spot an error that warrants correction, please contact the editor at editorial-team@simplywallst.com. This article by Simply Wall St is general in nature. It does not constitute a recommendation to buy or sell any stock, and does not take account of your objectives, or your financial situation. Simply Wall St has no position in the stocks mentioned.
We aim to bring you long-term focused research analysis driven by fundamental data. Note that our analysis may not factor in the latest price-sensitive company announcements or qualitative material. Thank you for reading.
