Are Johnson Matthey Plc’s (LON:JMAT) Returns On Investment Worth Your While?

Today we are going to look at Johnson Matthey Plc (LON:JMAT) to see whether it might be an attractive investment prospect. Specifically, we're going to calculate its Return On Capital Employed (ROCE), in the hopes of getting some insight into the business.
First, we'll go over how we calculate ROCE. Next, we'll compare it to others in its industry. Last but not least, we'll look at what impact its current liabilities have on its ROCE.
Understanding Return On Capital Employed (ROCE)
ROCE measures the amount of pre-tax profits a company can generate from the capital employed in its business. Generally speaking a higher ROCE is better. In brief, it is a useful tool, but it is not without drawbacks. Renowned investment researcher Michael Mauboussin has suggested that a high ROCE can indicate that 'one dollar invested in the company generates value of more than one dollar'.
How Do You Calculate Return On Capital Employed?
The formula for calculating the return on capital employed is:
Return on Capital Employed = Earnings Before Interest and Tax (EBIT) ÷ (Total Assets - Current Liabilities)
Or for Johnson Matthey:
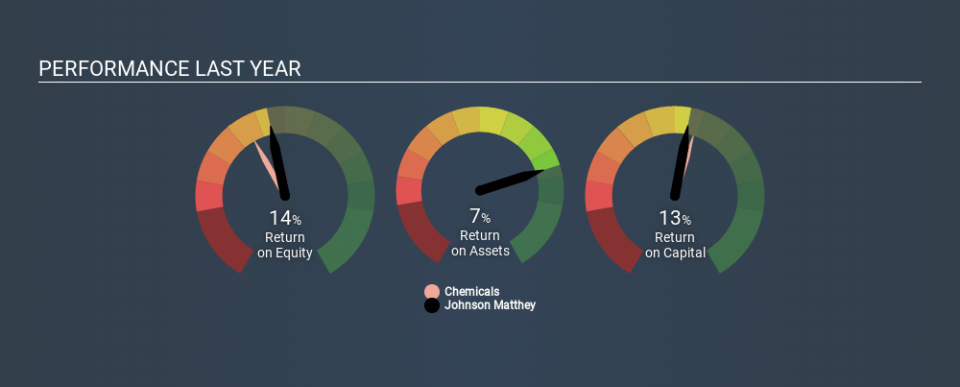
0.13 = UK£550m ÷ (UK£6.5b - UK£2.3b) (Based on the trailing twelve months to September 2019.)
So, Johnson Matthey has an ROCE of 13%.
See our latest analysis for Johnson Matthey
Does Johnson Matthey Have A Good ROCE?
ROCE is commonly used for comparing the performance of similar businesses. We can see Johnson Matthey's ROCE is around the 13% average reported by the Chemicals industry. Separate from Johnson Matthey's performance relative to its industry, its ROCE in absolute terms looks satisfactory, and it may be worth researching in more depth.
You can click on the image below to see (in greater detail) how Johnson Matthey's past growth compares to other companies.
When considering ROCE, bear in mind that it reflects the past and does not necessarily predict the future. ROCE can be misleading for companies in cyclical industries, with returns looking impressive during the boom times, but very weak during the busts. ROCE is only a point-in-time measure. Future performance is what matters, and you can see analyst predictions in our free report on analyst forecasts for the company.
What Are Current Liabilities, And How Do They Affect Johnson Matthey's ROCE?
Liabilities, such as supplier bills and bank overdrafts, are referred to as current liabilities if they need to be paid within 12 months. Due to the way ROCE is calculated, a high level of current liabilities makes a company look as though it has less capital employed, and thus can (sometimes unfairly) boost the ROCE. To counter this, investors can check if a company has high current liabilities relative to total assets.
Johnson Matthey has current liabilities of UK£2.3b and total assets of UK£6.5b. Therefore its current liabilities are equivalent to approximately 36% of its total assets. With this level of current liabilities, Johnson Matthey's ROCE is boosted somewhat.
The Bottom Line On Johnson Matthey's ROCE
With a decent ROCE, the company could be interesting, but remember that the level of current liabilities make the ROCE look better. There might be better investments than Johnson Matthey out there, but you will have to work hard to find them . These promising businesses with rapidly growing earnings might be right up your alley.
If you like to buy stocks alongside management, then you might just love this free list of companies. (Hint: insiders have been buying them).
If you spot an error that warrants correction, please contact the editor at editorial-team@simplywallst.com. This article by Simply Wall St is general in nature. It does not constitute a recommendation to buy or sell any stock, and does not take account of your objectives, or your financial situation. Simply Wall St has no position in the stocks mentioned.
We aim to bring you long-term focused research analysis driven by fundamental data. Note that our analysis may not factor in the latest price-sensitive company announcements or qualitative material. Thank you for reading.
