Juggernaut Exploration (CVE:JUGR) Will Have To Spend Its Cash Wisely
There's no doubt that money can be made by owning shares of unprofitable businesses. For example, although Amazon.com made losses for many years after listing, if you had bought and held the shares since 1999, you would have made a fortune. Having said that, unprofitable companies are risky because they could potentially burn through all their cash and become distressed.
Given this risk, we thought we'd take a look at whether Juggernaut Exploration (CVE:JUGR) shareholders should be worried about its cash burn. In this report, we will consider the company's annual negative free cash flow, henceforth referring to it as the 'cash burn'. We'll start by comparing its cash burn with its cash reserves in order to calculate its cash runway.
See our latest analysis for Juggernaut Exploration
Does Juggernaut Exploration Have A Long Cash Runway?
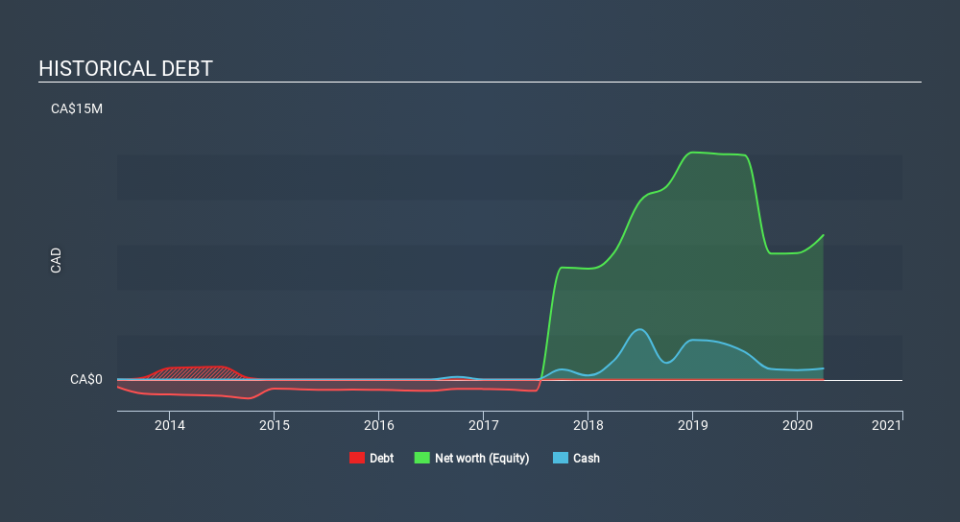
A company's cash runway is calculated by dividing its cash hoard by its cash burn. As at March 2020, Juggernaut Exploration had cash of CA$612k and no debt. In the last year, its cash burn was CA$2.4m. So it had a cash runway of approximately 3 months from March 2020. That's a very short cash runway which indicates an imminent need to douse the cash burn or find more funding. The image below shows how its cash balance has been changing over the last few years.
How Is Juggernaut Exploration's Cash Burn Changing Over Time?
Because Juggernaut Exploration isn't currently generating revenue, we consider it an early-stage business. So while we can't look to sales to understand growth, we can look at how the cash burn is changing to understand how expenditure is trending over time. As it happens, the company's cash burn reduced by 53% over the last year, which suggests that management are mindful of the possibility of running out of cash. Admittedly, we're a bit cautious of Juggernaut Exploration due to its lack of significant operating revenues. So we'd generally prefer stocks from this list of stocks that have analysts forecasting growth.
Can Juggernaut Exploration Raise More Cash Easily?
While we're comforted by the recent reduction evident from our analysis of Juggernaut Exploration's cash burn, it is still worth considering how easily the company could raise more funds, if it wanted to accelerate spending to drive growth. Issuing new shares, or taking on debt, are the most common ways for a listed company to raise more money for its business. Commonly, a business will sell new shares in itself to raise cash to drive growth. By comparing a company's annual cash burn to its total market capitalisation, we can estimate roughly how many shares it would have to issue in order to run the company for another year (at the same burn rate).
Juggernaut Exploration's cash burn of CA$2.4m is about 61% of its CA$3.9m market capitalisation. That's very high expenditure relative to the company's size, suggesting it is an extremely high risk stock.
Is Juggernaut Exploration's Cash Burn A Worry?
There are no prizes for guessing that we think Juggernaut Exploration's cash burn is a bit of a worry. In particular, we think its cash runway suggests it isn't in a good position to keep funding growth. On the other hand at least it could boast rather strong cash burn reduction, which no doubt gives shareholders some comfort. After considering the data discussed in this article, we don't have a lot of confidence that its cash burn rate is prudent, as it seems like it might need more cash soon. Taking a deeper dive, we've spotted 5 warning signs for Juggernaut Exploration you should be aware of, and 4 of them make us uncomfortable.
Of course, you might find a fantastic investment by looking elsewhere. So take a peek at this free list of companies insiders are buying, and this list of stocks growth stocks (according to analyst forecasts)
Love or hate this article? Concerned about the content? Get in touch with us directly. Alternatively, email editorial-team@simplywallst.com.
This article by Simply Wall St is general in nature. It does not constitute a recommendation to buy or sell any stock, and does not take account of your objectives, or your financial situation. We aim to bring you long-term focused analysis driven by fundamental data. Note that our analysis may not factor in the latest price-sensitive company announcements or qualitative material. Simply Wall St has no position in any stocks mentioned. Thank you for reading.
