Jupai - A Value Play in a High Growing Industry
NEW YORK, NY / ACCESSWIRE / November 9, 2017 / Stone Street Group LLC ("Stone Street") publishes research reports on publicly-traded companies. Stone Street has been retained by the company discussed in this report (the "Company") to provide ongoing digital investor relations services, including the creation and dissemination of this report. All research published by Stone Street is based on public information, or on information from the Company that the Company is required to promptly make public.
Stone Street is not a broker-dealer or a "covered person" under SEC Regulation AC, and does not distribute its research through a registered broker-dealer or any associated person of a registered broker-dealer. Accordingly, Stone Street is exempt from the provisions of Regulation AC. Nevertheless, Stone Street makes the following voluntary disclosures and disclaimers in connection with its research reports:
NO GUARANTEE: This research report is not a substitute for the exercise of an investor's independent judgment. Information contained herein is based on sources we believe to be reliable but we do not guarantee their accuracy. It should be presumed that the analyst who authored this report has had discussions with the Company to ensure factual accuracy prior to publication. Recipients of this report should consider this report as only one factor in making their investment decisions. This report is for information purposes only and is not intended as an offer to sell or a solicitation to buy securities.
NO CONFLICTS OF INTEREST: Stone Street does NOT own securities of the issuers described herein, and Stone Street does not make a market in any securities. Stone Street does not engage in, or receive compensation from, any investment banking or corporate finance-related activities with the company discussed in the report. Stone Street's contracts with issuers protect Stone Street's full editorial control of all research, timing of release of reports, and release from liability for negative reports. As of the date of this report, Stone Street was not aware of any plans by the Company to issue, purchase, sell, hypothecate or otherwise transfer securities of the Company within three months following the issuance of the report.
ANALYST INDEPENDENCE: Each Stone Street analyst has full discretion on the analysis and revenue targets contained in the report, based on his or her own due diligence. Analysts are paid in part based on overall profitability of Stone Street. No part of analyst compensation was, or will be, directly or indirectly, related to the specific recommendations or views expressed in any report or article. Stone Street policy does not allow an analyst or a member of their household (i) to own, trade, or have any beneficial interest in any securities of any company that analyst covers, or (ii) serve as an officer or director of a covered company.
RISK FACTORS: Earnings targets and opinions concerning the composition of market sectors included in this report reflect analyst judgments as of this date and are subject to change without notice. A risk to our earnings targets is that the analyst's estimates or forecasts may not be met. This report contains forward-looking statements, which involve risks and uncertainties. Actual results may differ significantly from such forward-looking statements. Factors that may cause such differences include, but are not limited to, those discussed in the "Risk Factors" section in the issuer's SEC filings available in electronic format through SEC Edgar filings at www.sec.gov.
COMPENSATION: Stone Street received a flat fee from the Company for the creation and dissemination of the report. Stone Street has not received investment banking income from the Company in the past 12 months, and does not expect to receive investment banking income from the Company in the next 12 months.
ANALYST CERTIFICATION: The research analyst certifies that this report accurately reflects his/her personal views about the Company's securities that none of the research analyst's compensation was, is or will be, directly or indirectly, related to the analyst's specific recommendations or views contained in this research report.
Jupai Holdings Limited
Exchange: NYSE: JP
Jupai Holdings Limited (Jupai), formerly Jupai Investment Group, is a leading third-party wealth management (WM) service provider to high-net-worth individuals (HNWIs) in China.
Investment Thesis
Substantial growth potential in China's expanding WM sector
China's private WM sector remains highly fragmented and severely under-served, compared to developed countries like the US and UK. Such premise allows substantial growth potential for the third-party wealth managers in China, evidenced by the more than eight fold of increase in the number of HNWIs over the past 10 years. Total investible assets held by HNWIs amounted to RMB 49 trillion in 2016, and are expected to reach RMB 58 trillion by the end of 2017. Consequently, the Company posted robust net revenue growth at a CAGR of 110% 2012-16, and continued to grow rapidly in 1H-2017 amidst an under-penetrated WM market.
Extensive network coverage ensures deeper client relationships
Jupai has strategically located its client centers in China's key markets - the Bohai Rim, Yangtze River Delta, and Pearl River Delta regions, homes to more than 80% of all HNWIs in China. The extensive client service team, comprised of 450 relationship managers and 1,160 advisors as of June 30, 2017, has enabled the Company to enjoy high client loyalty, forged by its client-centric business model and evidenced by a constant increase in repeat purchases to 56% in 2016.
Effective cost control and economies of scale ink strong financial metrics
Jupai posted strong financial results for 1H-2017, with net revenue increasing 72% YoY to RMB 805 million. Its operating margin doubled to 36.2% in the period, driven by ongoing cost reduction measures supported by its economies of scale. It also registered strong bottom-line growth, with net income and fully diluted earnings per ADS(each representing six ordinary share) tripled to RMB 203 million and RMB 6.02 respectively in 1H-2017.
Shares undervalued versus direct peers across valuation metrics
Jupai currently trades at 12.2x EV/EBITDA and 14.8x TTM PE ratio, compared to its closest direct competitor of 25.1x and 22.5x respectively, despite of the Company's net revenues growth of 110% CAGR 2012 - 2016, more than double that of its competitor, and net income CAGR growth of 65%, versus its peer of 43% for the same period. The Company remains significantly undervalued across almost all valuation metrics, leaving ample room for appreciation as shares revalued to the upside, justified by its strong growth profile.
I. Company Overview
Introduction
Founded in 2010, the Company is a leading third-party wealth management (WM) service provider, focused on distributing WM products and rendering wealth advisory as well as asset management services to high-net-worth individuals (HNWIs) in China. The company has diversified service offerings, comprising both third-party products and in-house asset management capabilities. Its product portfolio includes FI products, private equity/venture capital funds and public market products such as mutual/hedge funds, along with customized alternate investment vehicles, having served more than 10,200 clients in 2016 with an aggregate value of distributed WM products of around RMB 45 billion. The Company uniquely focus on conservative HNWIs with merely over USD 0.5 million of investable assets, and has either directly developed/managed, or helped to design around RMB 38 billion out of the total RMB 45 billion worth of products it served last year.
Jupai connects HNWIs and WM product providers and corporate borrowers. Jupai sourced third-party products from eight domestic and seven overseas product providers that it recommended to clients in 2016. The company derives most of its revenue from commissions on product distribution - it earns one-time commissions on product distribution and recurring service fees on some PE/VC products, public-market products, and some FI products. These offerings help Jupai's asset-light balance sheet, reducing the debt burden and providing full inherent value to its shareholders. The company's WM product advisory services are complemented by its asset management services for real-estate or related funds, other specialized fund products and funds of funds.
A client-centric business model, combined with high client loyalty, leads to repeat purchases. A survey of HNWIs reveals that "brand name and trust", together with the WM "team's expertise" are the two most important criteria for selecting a wealth manger, according to the 2017 China Private Wealth Report jointly issued by China Merchants Bank and Bain & Company. This reflects the fact that HNWIs have become more mature in selecting wealth managers.
Exhibit 1 Jupai's business model

Source: Jupai's 2Q-2017 investor presentation
Operating through an extensive network
As of June 30 2017, Jupai operates through a robust network of 76 WM centers in 47 economically vibrant cities in China, compared to 79 WM centers in 43 cities in 2016; this slight decline is due to its ongoing strategic amalgamation of smaller centers. It strategically brings services closer to clients by maintaining a physical presence in key markets such as the Bohai Rim, Yangtze River Delta, and Pearl River Delta regions, home to more than 80% of China's HNWIs. Around 50% of HNWIs are concentrated in five municipalities and provinces, namely Beijing, Jiangsu, Shanghai, Zhejiang and Guangdong.
Exhibit 2 Jupai's strategic network targets reaching the maximum number of HNWIs

Source: Jupai's 2Q-2017 investor presentation
Strategic Partnership Alliances
1. Synergies from the E-House acquisition
The partnership with E-House provides a significant advantage over competitors since Jupai enjoys greater access to market information through collaboration with E-House's real-estate sales agency business and has full access to CRIC, a wholly owned subsidiary of E-House and China's largest real-estate data center. Direct contact with real-estate developers allows Jupai to distribute more attractive and differentiated self-developed WM products compared to its competitors and to reduce intermediate layers and associated expenses to maximize client benefit.
2. Partnerships with Julius Baer and Sina
Management views the investment by Julius Baer, a global leading private WM bank, as a strong endorsement in building Jupai's global brand awareness. The partnership further strengthens Jupai's brand and management, and is complementary to its existing product categories by adding more overseas financial products to its offerings, to better meet client demand for overseas asset allocation. In addition, Julius Baer's valuable experience in the WM sector further enhances the expertise of Jupai's financial advisors. Sina is a leading online media company in China, is another partner with Jupai. The association supports Jupai's brand recognition and increase product awareness among potential investors in China. Sina held a stake of around 11.21% and Julius Baer a stake of around 4.93% in Jupai as of June 30, 2017.
Product Mix
Jupai's product mix covers FI, PE, public-market, and other products such as insurance products and overseas investments. FI products as a percentage of all products were high, primarily due to Jupai following a conservative risk profile preferred by the majority of its HNWI clients. However, the subsidiary company, Juzhou Asset Management, founded by Jupai in 2013, enabled it to provide more diversified products, so the FI products distributed by Jupai as a % of the total transaction value had come down from around 99% in 2013 to 66% in 2016, while rebounded to 81% in 1H-2017, as in-house developed FI products continued growing.
a. Fixed income (FI) products
The products include investments in corporate bonds, including real estate-related bonds, or government bonds, either directly or through asset management plans by mutual fund or securities companies and collateralized FI products by trust companies and fund-of-funds products.
b. Private equity and venture capital (PE/VC) funds
These relate to direct investments in PE and VC funds sponsored by leading domestic or international asset management companies, and indirect investments in such funds via participation in asset management plans sponsored by mutual fund management companies or securities companies.
c. Public-market products
These products invest in publicly traded securities in China, primarily in securities of companies publicly traded in capital markets via vehicles such as privately raised funds investing in publicly traded stocks and bonds, sponsored by leading asset management companies in China.
d. Other products
These include insurance products and other investments that are alternative to traditional products. Jupai works with insurance companies and insurance brokerage firms both in China and overseas to introduce products such as whole life coverage and universal life coverage.
Jupai's tailor-made solutions meet clients' changing asset allocation needs
HNWIs tend to turn to moderate risk/return investments from high risk/return ones amid uncertain market conditions. Jupai's strategy has been to change its product mix as the macroeconomy and investor risk appetite and preferences change. PE/VC funds' share of products distributed was 0.2% in 2013; this increased to 26.2% in 2015 and dropped to 21.0% in 2016. The share of FI products was 99.5% in 2013; this dropped to 54.3% in 2015 and recovered to 66.0% in 2016.
Exhibit 3 History of Jupai's product mix (WM)

Source: Jupai's 2Q-2017 investor presentation
Increasing in-house product development
Jupai started to develop products in-house in 2013; this has enabled it to participate in managing investment in its self-developed products, and to increase recurring management fees from distributing these products. Jupai either directly developed and managed or helped to design approximately RMB 6.6 billion worth of the products it distributed in 2014, RMB 22.7 billion in 2015, and RMB 37.8 billion in 2016. However, the percentage of PE and VC fund products has increased significantly since 2014 due to their more attractive returns. Jupai plans to increase the percentage of self-developed products, to increase its recurring cash flow.
A one-stop shop
Jupai serves as a one-stop WM product aggregator. In addition to products developed and managed in-house, it also sources products from the third parties, including eight domestic and seven overseas product providers that it recommended to clients in 2016. The aggregate value of WM products distributed was RMB 13.3 billion in 2014, RMB 28.4 billion in 2015, and RMB 45.3 billion in 2016.
Growing recurring management fees versus one-time commissions
Jupai has two key broad service lines that generate revenue – one-time commissions and recurring fees. One-time commissions are calculated based on the value of products it distributes to clients, and recurring fees are from product providers that pay Jupai for raising funds. Jupai also charges major recurring fees for some PE and public-market products that it distributes. Recurring service fees on FI products amount to 0.2-1.5%, while recurring management service fees on FI products amounts to 0.2-2%. In 2013, Jupai started generating revenue from recurring management fees for providing asset management services. The share of net revenue from both recurring management fees and recurring service fees grew to 34% in 2016 from 3% in 2013. The share of revenue from one-time commissions dropped to 56% of net revenue in 2016 from 97% in 2013. Management believes this strategic swing towards increasing the share of recurring management and service fees would enhance visibility on future revenue growth
Exhibit 4 Net revenue by service line, 2012 to 1H-2017

Source: Jupai's 20F, 6K
FI products, for most of which Jupai has charged one-time commissions, have historically accounted for a larger share of its product mix. Jupai has rapidly increased distribution of PE and public-market products in recent years, for which it can charge recurring service fees. It has also started to charge recurring service and management fees on more FI products.
Exhibit 5 Types of products distributed, 2012 to 1H-2017

Source: Jupai's 20F, 6K
Growth Review
i) Revenue
Jupai's net revenue grew to USD 162.4 million in 2016 from USD 8.3 million in 2012 at a CAGR of 110% over the period. Revenue growth was robust in 1H-2017 as well, with net revenue increasing to USD 118.8 million from USD 71.4 million in 1H-2016 (+66.3% y/y). This was mainly due to an increase in one-time commissions to USD 68.6 million from USD 46.3 million during the period (+48.1% y/y) and an increase in recurring management fees to USD 23.8 million from USD 15.0 million (+58.5% y/y). Recurring service fees declined to USD 8.8 million in 1H-2017 from USD 10.1 million in 1H-2016 (-12.9% y/y). Management expects net revenue to grow by more than 30% y/y in 3Q-2017.
Exhibit 6 Net revenue and revenue growth, 2012 to 1H-2017

Source: Jupai's 20F, 6K
ii) Profitability
Jupai's net income attributable to ordinary shareholders grew to USD 29.9 million in 2016 from USD 4.0 million in 2012 at a CAGR of 65% over the period. It also posted strong net income growth in 1H-2017, with net income increasing to USD 30.0 million from USD 10.1 million in 1H-2016 (+196% y/y). Jupai's diluted EPS grew to USD 0.15 in 2016 from USD 0.04 in 2012, and the diluted EPS for 1H-2017 increased to USD 0.15 from USD 0.05 in 1H-2016, indicating a significant increase in profitability. Jupai has improved its cost structure over the past year, resulting in improved profitability margins. The gross margin increased to 63.2% in 1H-2017 from 57.7% in 2016, while the operating margin improved to 36.2% from 26.1% over the period due to better economies of scale and efficient cost management. Management expects further margin improvement.
Exhibit 7 Net income attributable to ordinary shareholders, 2012 to 1H-2017

Source: Jupai's 20F, 6K
iii) Customer base
Jupai's client-centric business model led to an increase in the number of its active clients to 10,218 in 2016 from 1,090 in 2012 at a CAGR of 75% over the period. Due to increased client loyalty boosted by its client-centric business model, repeat purchases have been rising steadily - the repeat purchase rate increased to 56% in 2016 from 21% in 2012.
Exhibit 8 Number of active customers Exhibit 9 Repeat purchase rate

Source: Jupai's 20F, 6K
Ownership Structure
The company's diversified and decentralized shareholder structure enables management's interests to be well aligned with those of ordinary shareholders.
Jupai's largest strategic shareholder is E-House, with a 35.27% stake, however, its senior management holds an 18.83% stake; other investors hold the remaining 27.61% stake. Jupai benefits from synergies with partners such as E-House and other strategic shareholders, including Sina Corporation, which holds 11.21% of the shares, and Swiss bank Julius Baer, which owns 4.93% of Jupai.
Jupai benefits from E-House's industry-specific expertise and knowledge for its product creation, while the partnership with Sina and Julius Baer helps raise its brand awareness and meet the increasing client demand for overseas investment allocations.
Exhibit 10 Jupai's ownership structure, 2Q-2017

Source: Jupai's 2Q-2017 investor presentation
II. Industry Overview
Wealth Management Industry Review
China's WM industry is still in its infancy - China's WM services sector is at an initial development stage, marked by low penetration, increasing complexity, highly fragmented, and robust growth. China's economic development in the past decade has led to a prosperous private wealth market, growing over five fold to RMB 165 trillion in 2016 at a 2006 – 2016 CAGR of around 20%. Moreover, the number of HNWIs in China has increased by more than eight times to 1.58 million in 2016 from mere 0.18 million in 2006, adding about 400 new HNWIs every day. The number of HNWIs with investible assets of more than RMB 10 million reached an all-time high in 2016, growing at an annual rate of 23% from 2014 to 2016, with investible assets of Chinese individuals reached RMB 165 trillion in 2016, growing at a CAGR of 21% from 2014 to 2016. The number of HNWIs and investible assets are expected to reach more than 1.87 million and RMB 188 trillion by 2017, respectively.
Exhibit 11 Total individual investible assets (RMB trillion), 2006 to 1H-2017

Source: "2017 China Private Wealth Report" by China Merchants Bank and Bain & Company
Bank deposits being reallocated into WM sector - The deposit growth rate slowed to 9% in 2015 from an average of more than 15% 2010 - 2014. This slowdown presents potential opportunities to develop the WM sector through the reallocation of bank deposits.
WM market sophistication further strengthens local participants' positions - As competition gets intensified and HNWIs are becoming more experienced, wealth managers are shifting their focus to enhancing expertise and customized business models. Leading market participants have earned client recognition for product innovation, professional services, and brand name. Foreign banks have been foraying aggressively into China's domestic WM market, however due to strict government regulation on renminbi business and limited service network in China, foreign banks have had to adjust their strategies and reposition themselves; meanwhile market shares of local private banks have surged in the past decade and have been increasing their lead over foreign banks since 2009. Independent WM companies appeared to have also gained market share from the foreign banks.
Expanding product offering of alternative asset allocation and overseas diversification - New-age HNWIs have evolved in investment mindset, preferring to diversify their funds through products across regions, currencies and types. The percentage of Chinese HNWIs with overseas investments grew to 60% in 1H-2017 from 20% in 2011. China's private banks have been actively building a presence in overseas markets by setting up branches or partnering with foreign institutions, but their presence remains limited. The emergence of VC, PE, and other alternative investments in recent years has created additional channels attractive to HNWIs, and they are now able to make such investments via the third-party private wealth managers, boosting demand for new wealth firms. New HNWIs investment objectives shifted to conservative wealth preservation - With financial markets continuing to evolve, the need for new WM products has resulted in a new value system among HNWIs - from "wealth creation" to "wealth safeguarding". This new breed of HNWIs appears to be favoring FI products with short durations over volatile stock markets on the backdrop of macroeconomic uncertainty in China. They have shifted their objectives to "preservation and inheritance of wealth" from "wealth creation", evidenced by the decrease in percentage of preference for high risk/return to merely 5% in 2017 from 20% in 2009.
Independent WM companies gaining market share - Pure play WM institutions have historically accounted for a lower share of HNWIs' domestic fund allocations, but have seen significant growth in recent years. Although the majority shares of HNWIs' assets are still held by joint-stock, state-owned or foreign banks, non-bank WM firms now account for a greater share of HNWIs' domestic assets, as the third-party WM firms are more flexible in offering a wider range of financial products and services than the private banks to attract HNWIs seeking high quality, differentiated services.
Exhibit 12 Trend of HNWIs' asset allocation in the domestic market, 2009 to 1H-2017
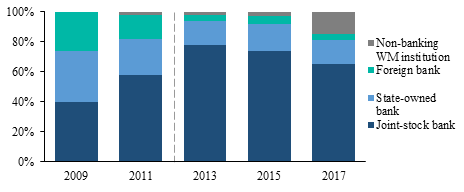
Source: "2017 China Private Wealth Report" by China Merchants Bank and Bain & Company
With China's WM institutions still in their infancy, growth potential is significant. Non-banking WM institutions like Jupai could therefore tap this opportunity to increase the scale and scope of their operations by capturing an increasing share of the domestic WM market.
III. Company Comparable Analysis
China's WM sector is at an early stage of development, with low market penetration and strong growth potential. It is highly fragmented, with thousands of WM service providers and no dominant market player. Jupai competes against the WM divisions of almost all the big commercial banks in China, as well as other independent asset managers.
Competitors
The following is a brief summary of Jupai's closest peers, against whom it is able to compete successfully by leveraging competitive advantages such as its cost-efficient tailor-made product offerings, customer-centric service model, synergies with E-House, extensive network in key locations, and significant first-mover advantage.
1. Noah Holdings Limited (Noah) - Jupai faces direct competition from Noah, a similar third-party wealth manager with a dominant market share in China's third-party WM space. Compared to Jupai, Noah offers highly diverse and complicated innovative products and services including factoring products, high-end investor education services, and offshore trust services which may well not be suitable for HNWIs with conservative appetite. Although Noah holds wider presence in majority HNWIs regions of Yangtze River Delta, the Pearl River Delta, and the Bohai Rim serving clients with 1,259 relationship managers across 205 branches in 76 cities in China, Jupai remains superior in terms of client service due to its proven service model run by 450 relationship managers and 1,160 business advisors. Noah's WM transaction value at USD 9.7 billion and AUM at USD 20.5 billion at end-2Q-2017 stands considerably higher than Jupai. Noah invested around 55% of AUM under PE products, while Jupai invested 56% of AUM under FI products more suited to its conservative client base.
2. CSC Financial operates in several segments and provides various investment banking and WM services. However, its product offerings appear to be lacking against those offered by Jupai, which provides customized WM and asset management products and services.
3. China Financial International Finance Group Ltd. operates in two core business areas - Agricultural and Integrated Financial Services. Its Agricultural business is well developed and in a mature stage. The Group has been actively developing its business blueprint in internet finance and money lending, to diversify its income streams and offset the cyclical nature of the Agricultural business. It is currently focusing on providing a comprehensive array of commercial and personal loan services in Hong Kong, such as basic and equity financing, cross-border financing, a peer-to-peer lending platform and mortgages.
Exhibit 13 Peer comparison of valuation multiples (by 11/09/2017)

Source: Bloomberg, Wind
IV. Financial Analysis (2Q-2017 earnings)
2Q-2017 versus 2Q-2016
Jupai's net revenue increased to USD 64.4 million in 2Q-2017 from USD 36.8 million in 2Q-2016 (+74.8% y/y) on an increased aggregate value of distributed WM products and increased values of AuM and other service fees. Jupai has benefited significantly from the cost-optimization program it initiated in 2016. Such cost-control measures were more pronounced in 2Q-2017, driving margins wider than in 2Q-2016. The gross profit margin improved to 62.9% from 59.5%, and the operating margin to 38.0% from 22.3%. The core efficiency ratio decreased to 62.4% from 77.7% during the period, representing higher cost effectiveness. Net income increased to USD 16.6 million in 2Q-2017 from USD 6.0 million in 2Q-2016 (+174.8% y/y), resulting in a net margin of 25.8% (versus 16.4% in 2Q-2016).
2Q-2017 versus 1Q-2017
Jupai's net revenue increased to USD 64.4 million in 2Q-2017 from USD 53.6 million in 1Q-2017 (+20.2% q/q) on increased one-time commissions, recurring management fees and other service fees.
Overall, Jupai continues to effectively control operating expenses, as evidenced by profit margins continuing to increase since 3Q-2016. Jupai initiated a cost-optimization program at the beginning of 2016, to widen margins. The operating margin improved to 38.0% in 2Q-2017 from 34.0% in 1Q-2017. However, it noted a slight increase in direct costs compared to 1Q-2017, primarily due to an increase in the number of WM advisors and client managers and their average compensation. This increase resulted in a 56bps decline in the gross profit margin to 62.9% in 2Q-2017. The core efficiency ratio decreased to 62.4% in 2Q-2017 from 67.0% in 1Q-2017, indicating higher cost productivity. Net income increased to USD 16.6 million in 2Q-2017 from USD 13.2 million in 1Q-2017 (+25.9% q/q), resulting in a net margin of 25.8% (versus 24.6% in 1Q-2017).
Exhibit 14 Jupai's margin performance

Source: Jupai's 2016, 2017 6K
V. Risks
Uncertain regulations
The Chinese government does not have a regulatory framework governing its financial services sector. The few financial services products in use, such as PE products, private securities investment funds and asset management plans managed by securities companies or mutual fund management companies are governed only by government rules and regulations. Any unfavorable regulation could affect Jupai's business operations and growth prospects.
Real-estate market investments
Jupai allocates a significant amount of investor funds to real estate and related markets, leveraging its partnership with E-House. Any decline in the real-estate sector could lead to a drop in value and return on investments, prompting investors to rapidly withdraw funds from the company, reducing revenue generated by its management services and resulting in a decline in the company's operating performance.
SOURCE: Stone Street Group LLC
