Who Just Ramped Up Their Shares In GWA Group Limited (ASX:GWA)?

GWA Group Limited engages in the research, design, manufacture, import, marketing, and distribution of building fixtures and fittings to residential and commercial premises in Australia, New Zealand, and international markets. GWA Group’s insiders have invested more than 8 million shares in the small-cap stocks within the past three months. It is widely considered that insider buying stock in their own companies is potentially a bullish signal. The MIT Press (1998) published an article showing that stocks following insider buying outperformed the market by 4.5%. But these signals may not be sufficient to gain confidence on whether to invest. Today we will evaluate whether these decisions are bolstered by analysts’ expectations of future growth as well as recent share price movements.
See our latest analysis for GWA Group
Who Are Ramping Up Their Shares?
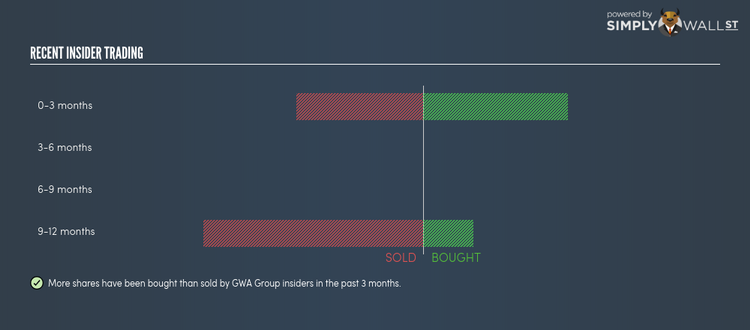
More shares have been bought than sold by GWA Group insiders in the past three months. In total, individual insiders own over 17 million shares in the business, which makes up around 6.32% of total shares outstanding. .
The entity that bought on the open market in the last three months was
Colonial First State Asset Management (Australia) Limited Investors Mutual Limited The Vanguard Group Inc.. Although this is an institutional investor, rather than a company executive or board member, the insights gained from direct access to management as a large investor would make it more well-informed than the average retail investor. In this specific instance, I would classify this investor as a company insider.
Is Future Growth Outlook As Bullish?
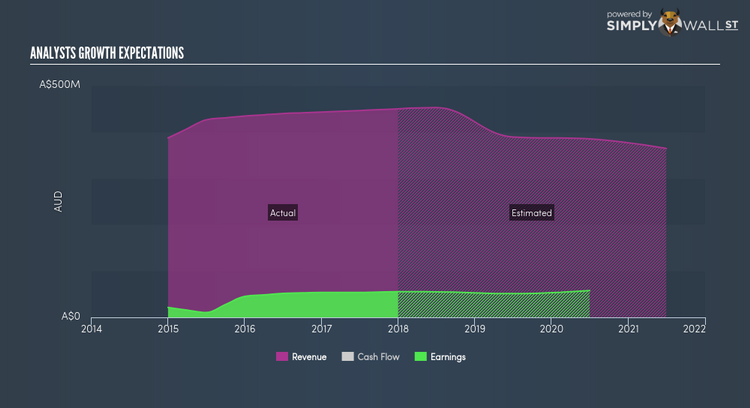
At first glance, analysts’ earnings expectations of 3.98% over the next three years illustrates a tamed outlook moving forward, however, insiders may be more optimistic than the market, with their net buying activity. Probing further into annual growth rates,GWA Group is expected to experience negative growth in its top-line over the next year, which indicates the company may be facing some headwinds. This will likely flow through to its earnings next year with a growth of -4.07%, implying cost management may not be efficient enough to bring the company into a positive growth zone. Although, insiders seem to know something the market does not and have been ramping up their holdings in times of uncertainty. This indicates they may see a turnaround or deem the stock to be over-penalized by negative market sentiment.
Did Stock Price Volatility Instigate Buying?
An alternative reason for recent trades could be insiders taking advantage of the share price volatility. A correlation could mean directors are trading on market inefficiencies based on their belief of the company’s intrinsic value. Within the past three months, GWA Group’s share price traded at a high of A$3.93 and a low of A$2.63. This indicates reasonably high share price volatility with a change of 49.43%. Insiders may deem this relatively meaningful movement as an opportunity to increase their shareholdings.
Next Steps:
GWA Group’s insider meaningful buying activity tells us the shares are currently in favour, although the expected earnings growth challenges this conclusion, whereas a fairly volatile stock price could be a driver to transact. Although insider buying can be a useful prompt, following the lead of an insider, however, will never replace diligent research. I’ve compiled two key factors you should further research:
Financial Health: Does GWA Group have a healthy balance sheet? Take a look at our free balance sheet analysis with six simple checks on key factors like leverage and risk.
Other High Quality Alternatives : Are there other high quality stocks you could be holding instead of GWA Group? Explore our interactive list of high quality stocks to get an idea of what else is out there you may be missing!
NB: Figures in this article are calculated using data from the last twelve months, which refer to the 12-month period ending on the last date of the month the financial statement is dated. This may not be consistent with full year annual report figures.
To help readers see pass the short term volatility of the financial market, we aim to bring you a long-term focused research analysis purely driven by fundamental data. Note that our analysis does not factor in the latest price sensitive company announcements.
The author is an independent contributor and at the time of publication had no position in the stocks mentioned.
