Is K-Bro Linen Inc.'s (TSE:KBL) Recent Performancer Underpinned By Weak Financials?
K-Bro Linen (TSE:KBL) has had a rough three months with its share price down 5.9%. To decide if this trend could continue, we decided to look at its weak fundamentals as they shape the long-term market trends. Specifically, we decided to study K-Bro Linen's ROE in this article.
Return on equity or ROE is a key measure used to assess how efficiently a company's management is utilizing the company's capital. Put another way, it reveals the company's success at turning shareholder investments into profits.
View our latest analysis for K-Bro Linen
How Do You Calculate Return On Equity?
ROE can be calculated by using the formula:
Return on Equity = Net Profit (from continuing operations) ÷ Shareholders' Equity
So, based on the above formula, the ROE for K-Bro Linen is:
3.7% = CA$6.6m ÷ CA$181m (Based on the trailing twelve months to March 2022).
The 'return' is the income the business earned over the last year. Another way to think of that is that for every CA$1 worth of equity, the company was able to earn CA$0.04 in profit.
What Is The Relationship Between ROE And Earnings Growth?
We have already established that ROE serves as an efficient profit-generating gauge for a company's future earnings. Depending on how much of these profits the company reinvests or "retains", and how effectively it does so, we are then able to assess a company’s earnings growth potential. Assuming all else is equal, companies that have both a higher return on equity and higher profit retention are usually the ones that have a higher growth rate when compared to companies that don't have the same features.
A Side By Side comparison of K-Bro Linen's Earnings Growth And 3.7% ROE
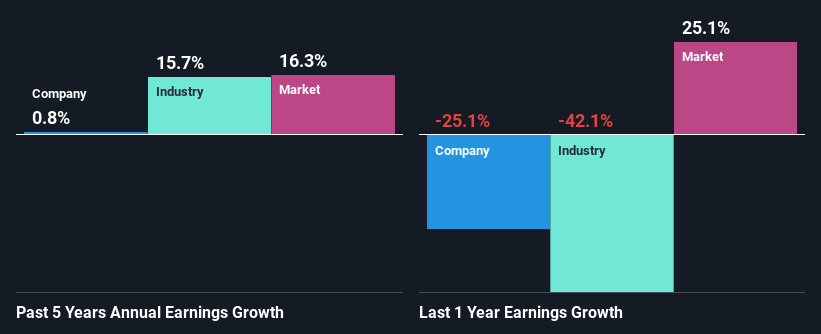
At first glance, K-Bro Linen's ROE doesn't look very promising. A quick further study shows that the company's ROE doesn't compare favorably to the industry average of 7.1% either. As a result, K-Bro Linen's flat net income growth over the past five years doesn't come as a surprise given its lower ROE.
We then compared K-Bro Linen's net income growth with the industry and found that the company's growth figure is lower than the average industry growth rate of 16% in the same period, which is a bit concerning.
Earnings growth is an important metric to consider when valuing a stock. It’s important for an investor to know whether the market has priced in the company's expected earnings growth (or decline). By doing so, they will have an idea if the stock is headed into clear blue waters or if swampy waters await. If you're wondering about K-Bro Linen's's valuation, check out this gauge of its price-to-earnings ratio, as compared to its industry.
Is K-Bro Linen Efficiently Re-investing Its Profits?
K-Bro Linen's very high three-year median payout ratio of 180% suggests that the company is paying its shareholders more than what it is earning. The absence in growth is therefore not surprising. Paying a dividend higher than reported profits is not a sustainable move. That's a huge risk in our books. Our risks dashboard should have the 2 risks we have identified for K-Bro Linen.
In addition, K-Bro Linen has been paying dividends over a period of at least ten years suggesting that keeping up dividend payments is way more important to the management even if it comes at the cost of business growth.
Conclusion
In total, we would have a hard think before deciding on any investment action concerning K-Bro Linen. Specifically, it has shown quite an unsatisfactory performance as far as earnings growth is concerned, and a poor ROE and an equally poor rate of reinvestment seem to be the reason behind this inadequate performance. Having said that, looking at the current analyst estimates, we found that the company's earnings are expected to gain momentum. To know more about the latest analysts predictions for the company, check out this visualization of analyst forecasts for the company.
Have feedback on this article? Concerned about the content? Get in touch with us directly. Alternatively, email editorial-team (at) simplywallst.com.
This article by Simply Wall St is general in nature. We provide commentary based on historical data and analyst forecasts only using an unbiased methodology and our articles are not intended to be financial advice. It does not constitute a recommendation to buy or sell any stock, and does not take account of your objectives, or your financial situation. We aim to bring you long-term focused analysis driven by fundamental data. Note that our analysis may not factor in the latest price-sensitive company announcements or qualitative material. Simply Wall St has no position in any stocks mentioned.
