What Kind Of Risk Should You Expect For Rosetta Genomics Ltd (NASDAQ:ROSG)?

If you are a shareholder in Rosetta Genomics Ltd’s (NASDAQ:ROSG), or are thinking about investing in the company, knowing how it contributes to the risk and reward profile of your portfolio is important. The beta measures ROSG’s exposure to the wider market risk, which reflects changes in economic and political factors. Not all stocks are expose to the same level of market risk, and the market as a whole represents a beta of one. A stock with a beta greater than one is considered more sensitive to market-wide shocks compared to a stock that trades below the value of one.
Check out our latest analysis for Rosetta Genomics
What is ROSG’s market risk?
Rosetta Genomics’s beta of 0.48 indicates that the company is less volatile relative to the diversified market portfolio. This means the stock is more defensive against the ups and downs of a stock market, moving by less than the entire market index in times of change. Based on this beta value, ROSG appears to be a stock that an investor with a high-beta portfolio would look for to reduce risk exposure to the market.
Does ROSG’s size and industry impact the expected beta?
A market capitalisation of US$2.55M puts ROSG in the category of small-cap stocks, which tends to possess higher beta than larger companies. Conversely, the company operates in the biotechs industry, which has been found to have low sensitivity to market-wide shocks. As a result, we should expect a high beta for the small-cap ROSG but a low beta for the biotechs industry. This is an interesting conclusion, since its size suggests ROSG should be more volatile than it actually is. A potential driver of this variance can be a fundamental factor, which we will take a look at next.
Is ROSG’s cost structure indicative of a high beta?
During times of economic downturn, low demand may cause companies to readjust production of their goods and services. It is more difficult for companies to lower their cost, if the majority of these costs are generated by fixed assets. Therefore, this is a type of risk which is associated with higher beta. I test ROSG’s ratio of fixed assets to total assets in order to determine how high the risk is associated with this type of constraint. Considering fixed assets account for less than a third of the company’s overall assets, ROSG seems to have a smaller dependency on fixed costs to generate revenue. Thus, we can expect ROSG to be more stable in the face of market movements, relative to its peers of similar size but with a higher portion of fixed assets on their books. Similarly, ROSG’s beta value conveys the same message.
What this means for you:
You may reap the benefit of muted movements during times of economic decline by holding onto ROSG. Its low fixed cost also means that, in terms of operating leverage, its costs are relatively malleable to preserve margins. In order to fully understand whether ROSG is a good investment for you, we also need to consider important company-specific fundamentals such as Rosetta Genomics’s financial health and performance track record. I highly recommend you to complete your research by taking a look at the following:
Financial Health: Is ROSG’s operations financially sustainable? Balance sheets can be hard to analyze, which is why we’ve done it for you. Check out our financial health checks here.
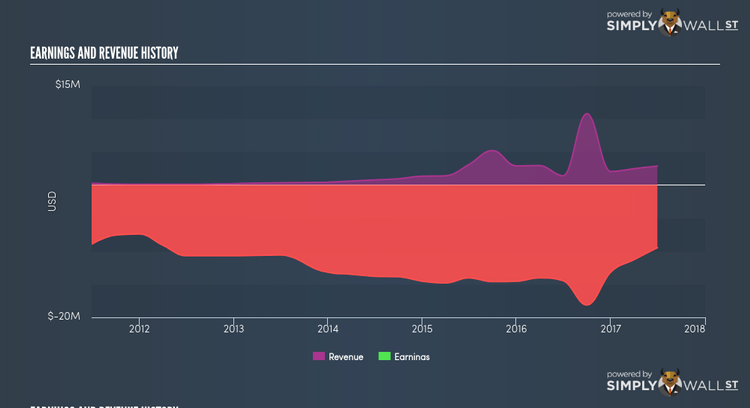
Past Track Record: Has ROSG been consistently performing well irrespective of the ups and downs in the market? Go into more detail in the past performance analysis and take a look at the free visual representations of ROSG’s historicals for more clarity.
Other High-Performing Stocks: Are there other stocks that provide better prospects with proven track records? Explore our free list of these great stocks here.
To help readers see pass the short term volatility of the financial market, we aim to bring you a long-term focused research analysis purely driven by fundamental data. Note that our analysis does not factor in the latest price sensitive company announcements.
The author is an independent contributor and at the time of publication had no position in the stocks mentioned.
