What Kind Of Share Price Volatility Should You Expect For Central Bank of India (NSE:CENTRALBK)?

Anyone researching Central Bank of India (NSE:CENTRALBK) might want to consider the historical volatility of the share price. Volatility is considered to be a measure of risk in modern finance theory. Investors may think of volatility as falling into two main categories. First, we have company specific volatility, which is the price gyrations of an individual stock. Holding at least 8 stocks can reduce this kind of risk across a portfolio. The second type is the broader market volatility, which you cannot diversify away, since it arises from macroeconomic factors which directly affects all the stocks on the market.
Some stocks mimic the volatility of the market quite closely, while others demonstrate muted, exagerrated or uncorrelated price movements. Beta is a widely used metric to measure a stock’s exposure to market risk (volatility). Before we go on, it’s worth noting that Warren Buffett pointed out in his 2014 letter to shareholders that ‘volatility is far from synonymous with risk.’ Having said that, beta can still be rather useful. The first thing to understand about beta is that the beta of the overall market is one. Any stock with a beta of greater than one is considered more volatile than the market, while those with a beta below one are either less volatile or poorly correlated with the market.
See our latest analysis for Central Bank of India
What does CENTRALBK’s beta value mean to investors?
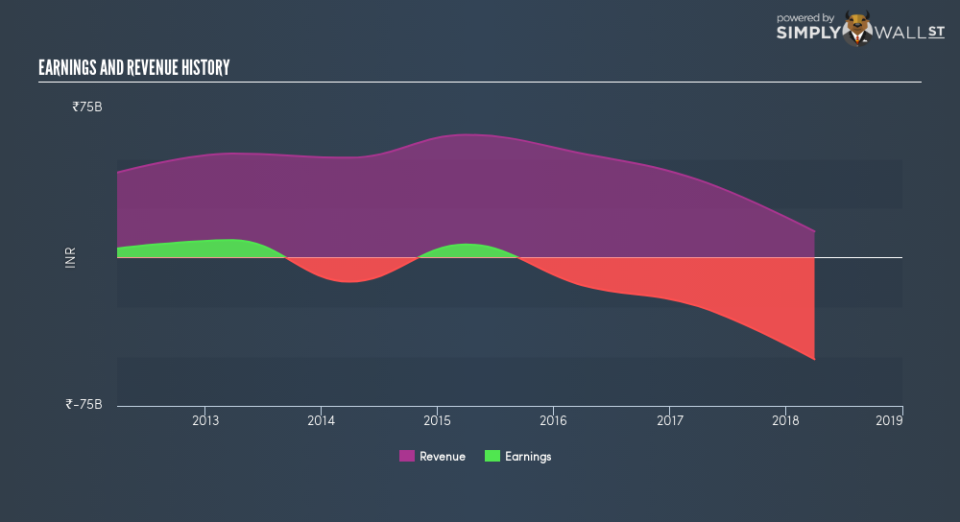
Looking at the last five years, Central Bank of India has a beta of 1.16. The fact that this is well above 1 indicates that its share price movements have shown sensitivity to overall market volatility. If the past is any guide, we would expect that Central Bank of India shares will rise quicker than the markets in times of optimism, but fall faster in times of pessimism. Many would argue that beta is useful in position sizing, but fundamental metrics such as revenue and earnings are more important overall. You can see Central Bank of India’s revenue and earnings in the image below.
Does CENTRALBK’s size influence the expected beta?
With a market capitalisation of ₹106b, Central Bank of India is a small cap stock. However, it is big enough to catch the attention of professional investors. It’s not particularly surprising that it has a higher beta than the overall market. That’s because it takes less money to influence the share price of a smaller company, than a bigger company.
What this means for you:
Beta only tells us that the Central Bank of India share price is sensitive to broader market movements. This could indicate that it is a high growth company, or is heavily influenced by sentiment because it is speculative. Alternatively, it could have operating leverage in its business model. Ultimately, beta is an interesting metric, but there’s plenty more to learn. This article aims to educate investors about beta values, but it’s well worth looking at important company-specific fundamentals such as Central Bank of India’s financial health and performance track record. I urge you to continue your research by taking a look at the following:
Financial Health: Are CENTRALBK’s operations financially sustainable? Balance sheets can be hard to analyze, which is why we’ve done it for you. Check out our financial health checks here.
Past Track Record: Has CENTRALBK been consistently performing well irrespective of the ups and downs in the market? Go into more detail in the past performance analysis and take a look at the free visual representations of CENTRALBK’s historicals for more clarity.
Other High-Performing Stocks: Are there other stocks that provide better prospects with proven track records? Explore our free list of these great stocks here.
To help readers see past the short term volatility of the financial market, we aim to bring you a long-term focused research analysis purely driven by fundamental data. Note that our analysis does not factor in the latest price-sensitive company announcements.
The author is an independent contributor and at the time of publication had no position in the stocks mentioned. For errors that warrant correction please contact the editor at editorial-team@simplywallst.com.
