What Kind Of Share Price Volatility Should You Expect For Cedar Realty Trust, Inc. (NYSE:CDR)?

Want to participate in a short research study? Help shape the future of investing tools and you could win a $250 gift card!
If you’re interested in Cedar Realty Trust, Inc. (NYSE:CDR), then you might want to consider its beta (a measure of share price volatility) in order to understand how the stock could impact your portfolio. Modern finance theory considers volatility to be a measure of risk, and there are two main types of price volatility. The first type is company specific volatility. Investors use diversification across uncorrelated stocks to reduce this kind of price volatility across the portfolio. The second type is the broader market volatility, which you cannot diversify away, since it arises from macroeconomic factors which directly affects all the stocks on the market.
Some stocks see their prices move in concert with the market. Others tend towards stronger, gentler or unrelated price movements. Beta is a widely used metric to measure a stock’s exposure to market risk (volatility). Before we go on, it’s worth noting that Warren Buffett pointed out in his 2014 letter to shareholders that ‘volatility is far from synonymous with risk.’ Having said that, beta can still be rather useful. The first thing to understand about beta is that the beta of the overall market is one. A stock with a beta below one is either less volatile than the market, or more volatile but not corellated with the overall market. In comparison a stock with a beta of over one tends to be move in a similar direction to the market in the long term, but with greater changes in price.
View our latest analysis for Cedar Realty Trust
What we can learn from CDR’s beta value
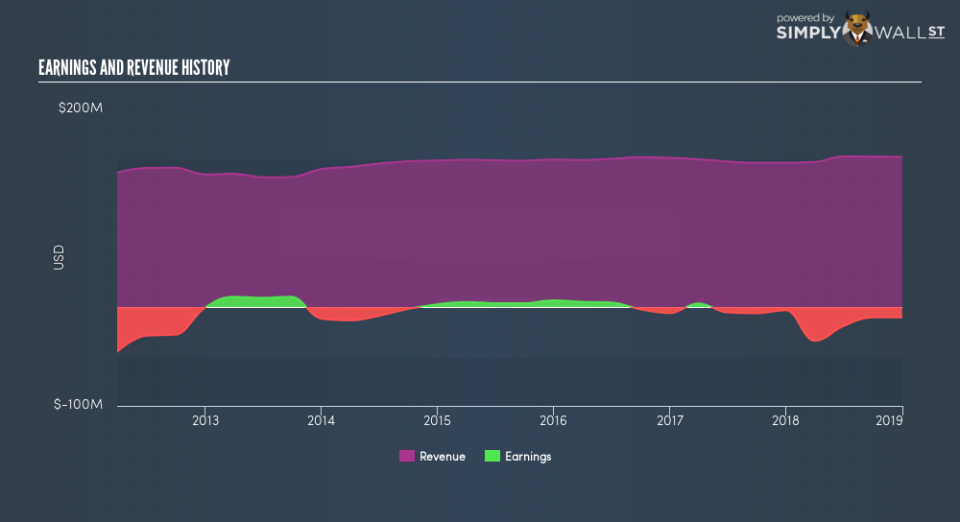
With a beta of 1.01, (which is quite close to 1) the share price of Cedar Realty Trust has historically been about as voltile as the broader market. If the future looks like the past, we could therefore consider it likely that the stock price will experience share price volatility that is roughly similar to the overall market. Many would argue that beta is useful in position sizing, but fundamental metrics such as revenue and earnings are more important overall. You can see Cedar Realty Trust’s revenue and earnings in the image below.
Could CDR’s size cause it to be more volatile?
With a market capitalisation of US$322m, Cedar Realty Trust is a very small company by global standards. It is quite likely to be unknown to most investors. It doesn’t take much money to really move the share price of a company as small as this one. That makes it somewhat unusual that it has a beta value so close to the overall market.
What this means for you:
Since Cedar Realty Trust has a beta close to one, it will probably show a positive return when the market is moving up, based on history. If you’re trying to generate better returns than the market, it would be worth thinking about other metrics such as cashflows, dividends and revenue growth might be a more useful guide to the future. This article aims to educate investors about beta values, but it’s well worth looking at important company-specific fundamentals such as Cedar Realty Trust’s financial health and performance track record. I urge you to continue your research by taking a look at the following:
Future Outlook: What are well-informed industry analysts predicting for CDR’s future growth? Take a look at our free research report of analyst consensus for CDR’s outlook.
Past Track Record: Has CDR been consistently performing well irrespective of the ups and downs in the market? Go into more detail in the past performance analysis and take a look at the free visual representations of CDR’s historicals for more clarity.
Other Interesting Stocks: It’s worth checking to see how CDR measures up against other companies on valuation. You could start with this free list of prospective options.
To help readers see past the short term volatility of the financial market, we aim to bring you a long-term focused research analysis purely driven by fundamental data. Note that our analysis does not factor in the latest price-sensitive company announcements.
The author is an independent contributor and at the time of publication had no position in the stocks mentioned. For errors that warrant correction please contact the editor at editorial-team@simplywallst.com.
