What Kind Of Shareholders Own CME Group Inc. (NASDAQ:CME)?

If you want to know who really controls CME Group Inc. (NASDAQ:CME), then you'll have to look at the makeup of its share registry. Generally speaking, as a company grows, institutions will increase their ownership. Conversely, insiders often decrease their ownership over time. We also tend to see lower insider ownership in companies that were previously publicly owned.
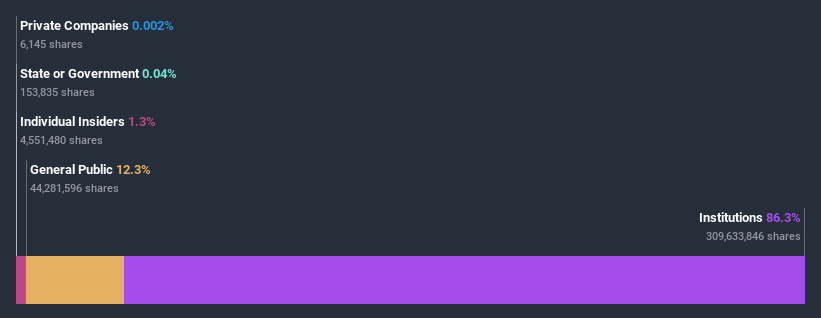
With a market capitalization of US$60b, CME Group is rather large. We'd expect to see institutional investors on the register. Companies of this size are usually well known to retail investors, too. In the chart below, we can see that institutions are noticeable on the share registry. Let's take a closer look to see what the different types of shareholders can tell us about CME Group.
View our latest analysis for CME Group
What Does The Institutional Ownership Tell Us About CME Group?
Many institutions measure their performance against an index that approximates the local market. So they usually pay more attention to companies that are included in major indices.
We can see that CME Group does have institutional investors; and they hold a good portion of the company's stock. This suggests some credibility amongst professional investors. But we can't rely on that fact alone since institutions make bad investments sometimes, just like everyone does. When multiple institutions own a stock, there's always a risk that they are in a 'crowded trade'. When such a trade goes wrong, multiple parties may compete to sell stock fast. This risk is higher in a company without a history of growth. You can see CME Group's historic earnings and revenue below, but keep in mind there's always more to the story.

Since institutional investors own more than half the issued stock, the board will likely have to pay attention to their preferences. Hedge funds don't have many shares in CME Group. Capital Research and Management Company is currently the company's largest shareholder with 16% of shares outstanding. The Vanguard Group, Inc. is the second largest shareholder owning 8.1% of common stock, and BlackRock, Inc. holds about 7.6% of the company stock.
Looking at the shareholder registry, we can see that 50% of the ownership is controlled by the top 13 shareholders, meaning that no single shareholder has a majority interest in the ownership.
Researching institutional ownership is a good way to gauge and filter a stock's expected performance. The same can be achieved by studying analyst sentiments. Quite a few analysts cover the stock, so you could look into forecast growth quite easily.
Insider Ownership Of CME Group
While the precise definition of an insider can be subjective, almost everyone considers board members to be insiders. The company management answer to the board and the latter should represent the interests of shareholders. Notably, sometimes top-level managers are on the board themselves.
I generally consider insider ownership to be a good thing. However, on some occasions it makes it more difficult for other shareholders to hold the board accountable for decisions.
We can see that insiders own shares in CME Group Inc.. Insiders own US$765m worth of shares (at current prices). I sometimes take an interest in whether they have been buying or selling.
General Public Ownership
The general public holds a 12% stake in CME Group. While this size of ownership may not be enough to sway a policy decision in their favour, they can still make a collective impact on company policies.
Next Steps:
It's always worth thinking about the different groups who own shares in a company. But to understand CME Group better, we need to consider many other factors. Be aware that CME Group is showing 2 warning signs in our investment analysis , you should know about...
If you would prefer discover what analysts are predicting in terms of future growth, do not miss this free report on analyst forecasts.
NB: Figures in this article are calculated using data from the last twelve months, which refer to the 12-month period ending on the last date of the month the financial statement is dated. This may not be consistent with full year annual report figures.
This article by Simply Wall St is general in nature. It does not constitute a recommendation to buy or sell any stock, and does not take account of your objectives, or your financial situation. We aim to bring you long-term focused analysis driven by fundamental data. Note that our analysis may not factor in the latest price-sensitive company announcements or qualitative material. Simply Wall St has no position in any stocks mentioned.
Have feedback on this article? Concerned about the content? Get in touch with us directly. Alternatively, email editorial-team@simplywallst.com.
