What Kind Of Shareholders Own Heritage Financial Corporation (NASDAQ:HFWA)?
A look at the shareholders of Heritage Financial Corporation (NASDAQ:HFWA) can tell us which group is most powerful. Institutions often own shares in more established companies, while it's not unusual to see insiders own a fair bit of smaller companies. Companies that have been privatized tend to have low insider ownership.
Heritage Financial has a market capitalization of US$827m, so we would expect some institutional investors to have noticed the stock. Taking a look at our data on the ownership groups (below), it seems that institutions own shares in the company. We can zoom in on the different ownership groups, to learn more about Heritage Financial.
Check out our latest analysis for Heritage Financial
What Does The Institutional Ownership Tell Us About Heritage Financial?
Many institutions measure their performance against an index that approximates the local market. So they usually pay more attention to companies that are included in major indices.
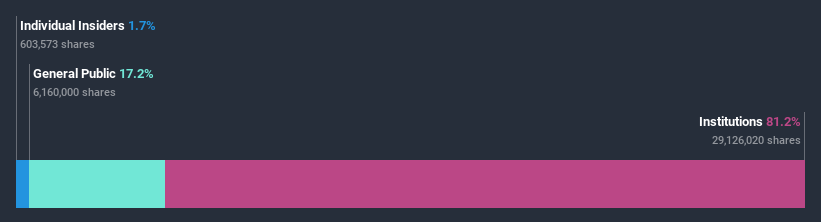
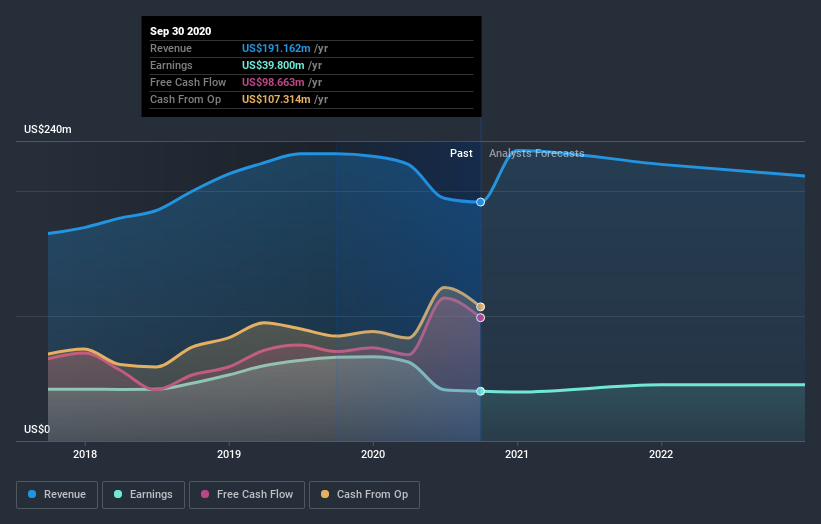
As you can see, institutional investors have a fair amount of stake in Heritage Financial. This suggests some credibility amongst professional investors. But we can't rely on that fact alone since institutions make bad investments sometimes, just like everyone does. If multiple institutions change their view on a stock at the same time, you could see the share price drop fast. It's therefore worth looking at Heritage Financial's earnings history below. Of course, the future is what really matters.
Institutional investors own over 50% of the company, so together than can probably strongly influence board decisions. We note that hedge funds don't have a meaningful investment in Heritage Financial. Our data shows that BlackRock, Inc. is the largest shareholder with 14% of shares outstanding. T. Rowe Price Group, Inc. is the second largest shareholder owning 10.0% of common stock, and The Vanguard Group, Inc. holds about 6.5% of the company stock.
We also observed that the top 9 shareholders account for more than half of the share register, with a few smaller shareholders to balance the interests of the larger ones to a certain extent.
While it makes sense to study institutional ownership data for a company, it also makes sense to study analyst sentiments to know which way the wind is blowing. There are a reasonable number of analysts covering the stock, so it might be useful to find out their aggregate view on the future.
Insider Ownership Of Heritage Financial
While the precise definition of an insider can be subjective, almost everyone considers board members to be insiders. The company management answer to the board and the latter should represent the interests of shareholders. Notably, sometimes top-level managers are on the board themselves.
I generally consider insider ownership to be a good thing. However, on some occasions it makes it more difficult for other shareholders to hold the board accountable for decisions.
Our most recent data indicates that insiders own some shares in Heritage Financial Corporation. It has a market capitalization of just US$827m, and insiders have US$14m worth of shares, in their own names. Some would say this shows alignment of interests between shareholders and the board. But it might be worth checking if those insiders have been selling.
General Public Ownership
The general public, with a 17% stake in the company, will not easily be ignored. While this group can't necessarily call the shots, it can certainly have a real influence on how the company is run.
Next Steps:
While it is well worth considering the different groups that own a company, there are other factors that are even more important. To that end, you should be aware of the 2 warning signs we've spotted with Heritage Financial .
But ultimately it is the future, not the past, that will determine how well the owners of this business will do. Therefore we think it advisable to take a look at this free report showing whether analysts are predicting a brighter future.
NB: Figures in this article are calculated using data from the last twelve months, which refer to the 12-month period ending on the last date of the month the financial statement is dated. This may not be consistent with full year annual report figures.
This article by Simply Wall St is general in nature. It does not constitute a recommendation to buy or sell any stock, and does not take account of your objectives, or your financial situation. We aim to bring you long-term focused analysis driven by fundamental data. Note that our analysis may not factor in the latest price-sensitive company announcements or qualitative material. Simply Wall St has no position in any stocks mentioned.
Have feedback on this article? Concerned about the content? Get in touch with us directly. Alternatively, email editorial-team (at) simplywallst.com.
